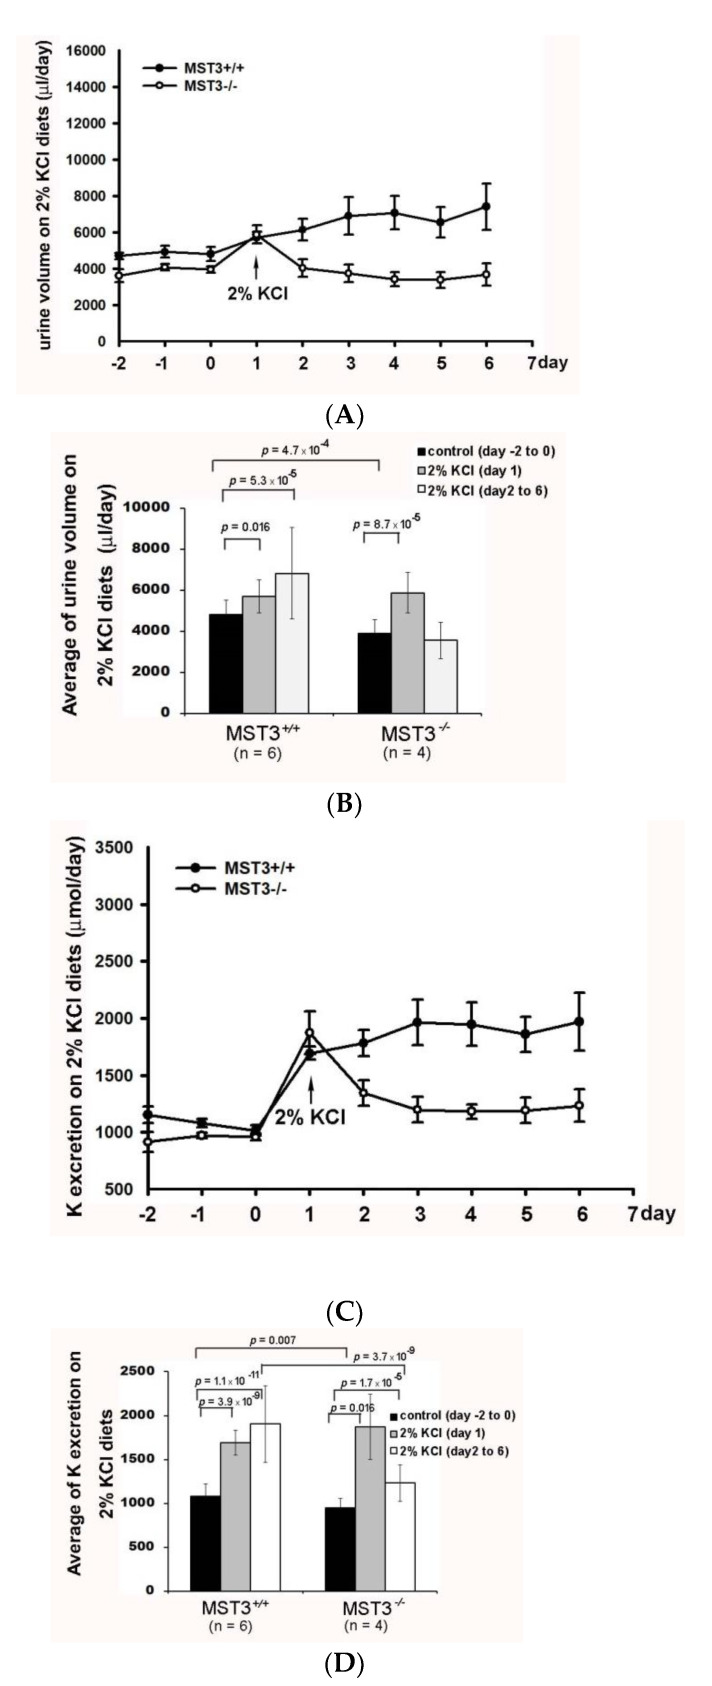
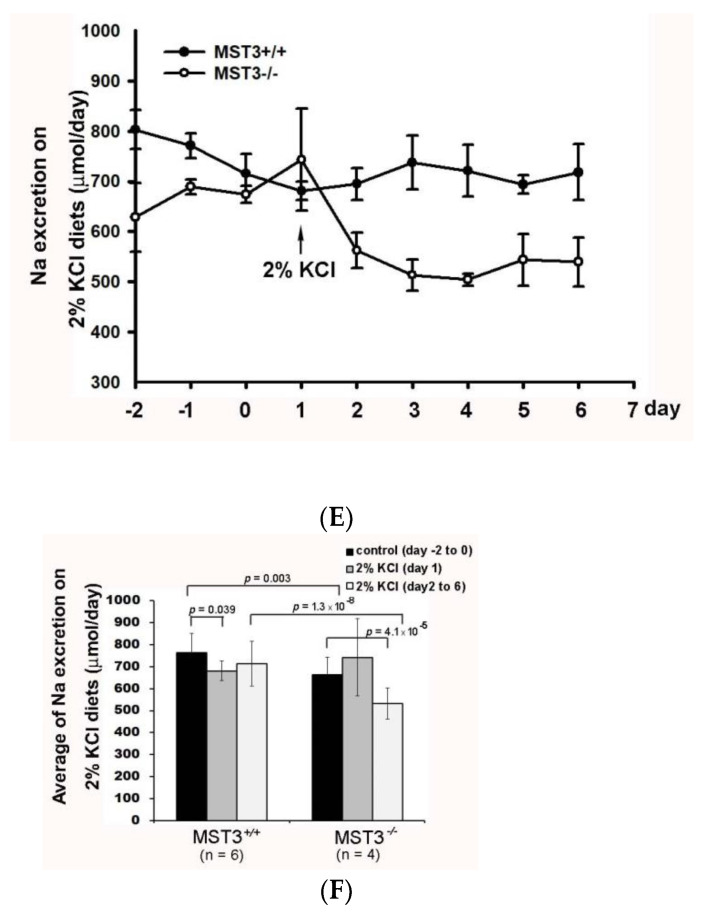
Figure 3.
Reduction of diuresis, kaliuresis, and natriuresis in MST3−/− mice fed 2% KCl diets. MST+/+ (●) and MST3−/− (○) mice were fed a control diet for 3 days; then, the diet was changed to the 2% KCl diet for an additional 16 days. The urine volume (A), urinary K+ (C), and urinary Na+ (E) excretion were recorded over 9 days. The average group values were used to generate the graphs, and the error bars correspond to SE. The bar graphs (B,D,F) show the average of the data in (A,C,E) respectively.


