Figure 4.
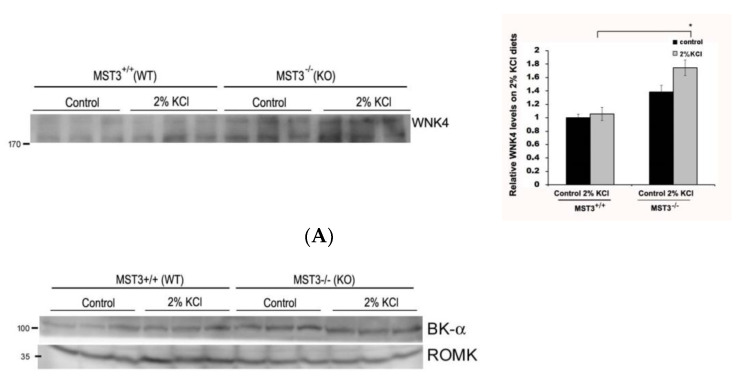
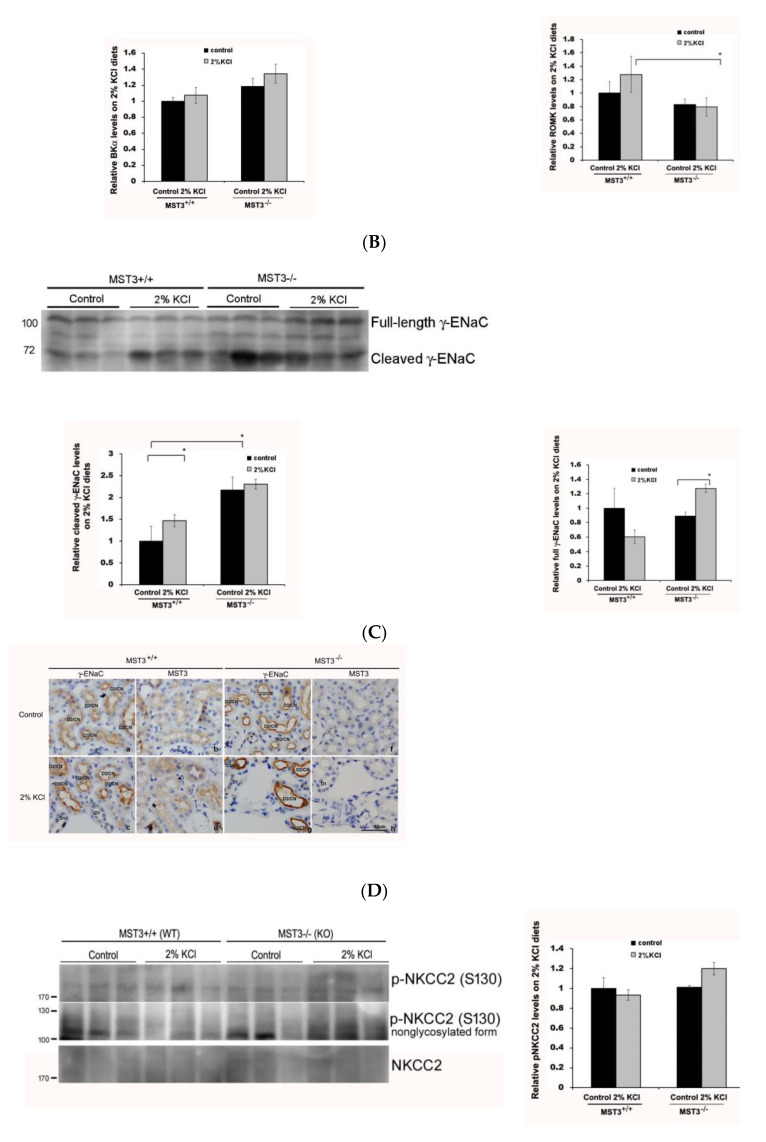
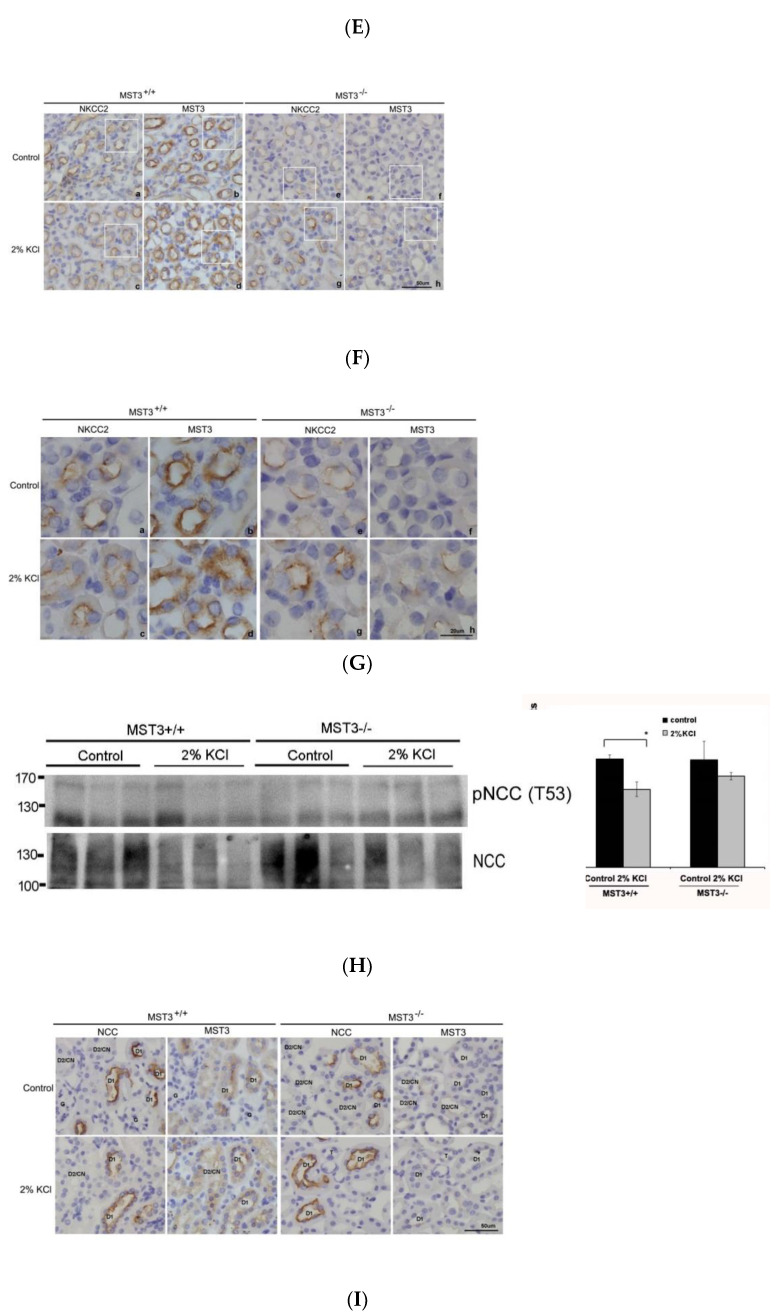
WNK4 and WNK4-regulated channels in mice fed 2% KCl diets. Western blot analysis of (A) WNK4, (B) BK, and ROMK, (C) γ-ENaC, (E) NKCC2, and p-NKCC2, and (H) NCC and p-NCC in the kidney of MST+/+ and MST3−/− mice 8 weeks after the treatment with the control and 2% KCl diets for 16 days (n = 3 animals/group). The bar graph shows quantification of Western blot relative to the levels in the control group of WT mice. * p < 0.05 vs. the control group. Serial sections of the kidney of WT and MST3−/− mice fed the control and 2% KCl diets were stained for γ-ENaC (D), NKCC2 (F,G, outlined images of F were enlarged using a 100× objective.), NCC (I), and MST3. G, glomerular; D1, early distal convoluted tubule; D2, late distal convoluted tubule; CN, connecting tubule.


