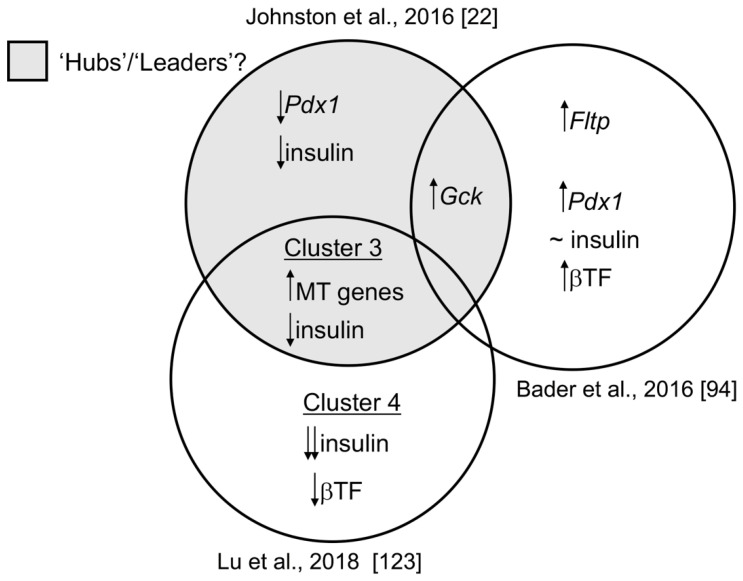
Figure 2.
Evaluating the overlap of defined transcriptomic heterogeneity between beta cell subpopulations in mice. “Hub” cells [22] exhibit lower Pdx1, Ins1 and higher Gck expression levels, as assessed by immunocytochemistry, indicative of a less mature but highly metabolic cell state. According to Bader et al. [94], FACS-sorting of islet beta cells into Fltp-positive and Fltp-negative populations revealed that the former was marked by expression of Pdx1 and several key beta cell transcription factors (βTF) and, similar to “hub” cells, by increased expression of Gck. Expression of insulin was similar between Fltp-positive and Fltp-negative beta cells. scRNA-sequencing of primary mouse beta cells by Lu et al. [123] revealed a population of beta cells (termed “cluster 3”) with increased mitochondrial (MT) gene expression and reduced expression of insulin, but with comparable levels of beta cell transcription factors (βTF) as mature beta cells (termed “clusters 1 and 2”), consistent with “hub” cells. “Cluster 4”, in this analysis, represents immature beta cells with significantly reduced insulin levels and key beta cell transcription factors (βTF). Whether the expression of imprinted genes is enriched in any of the above subpopulations remains to be determined. Black arrows represent up- or down regulation of gene expression.

