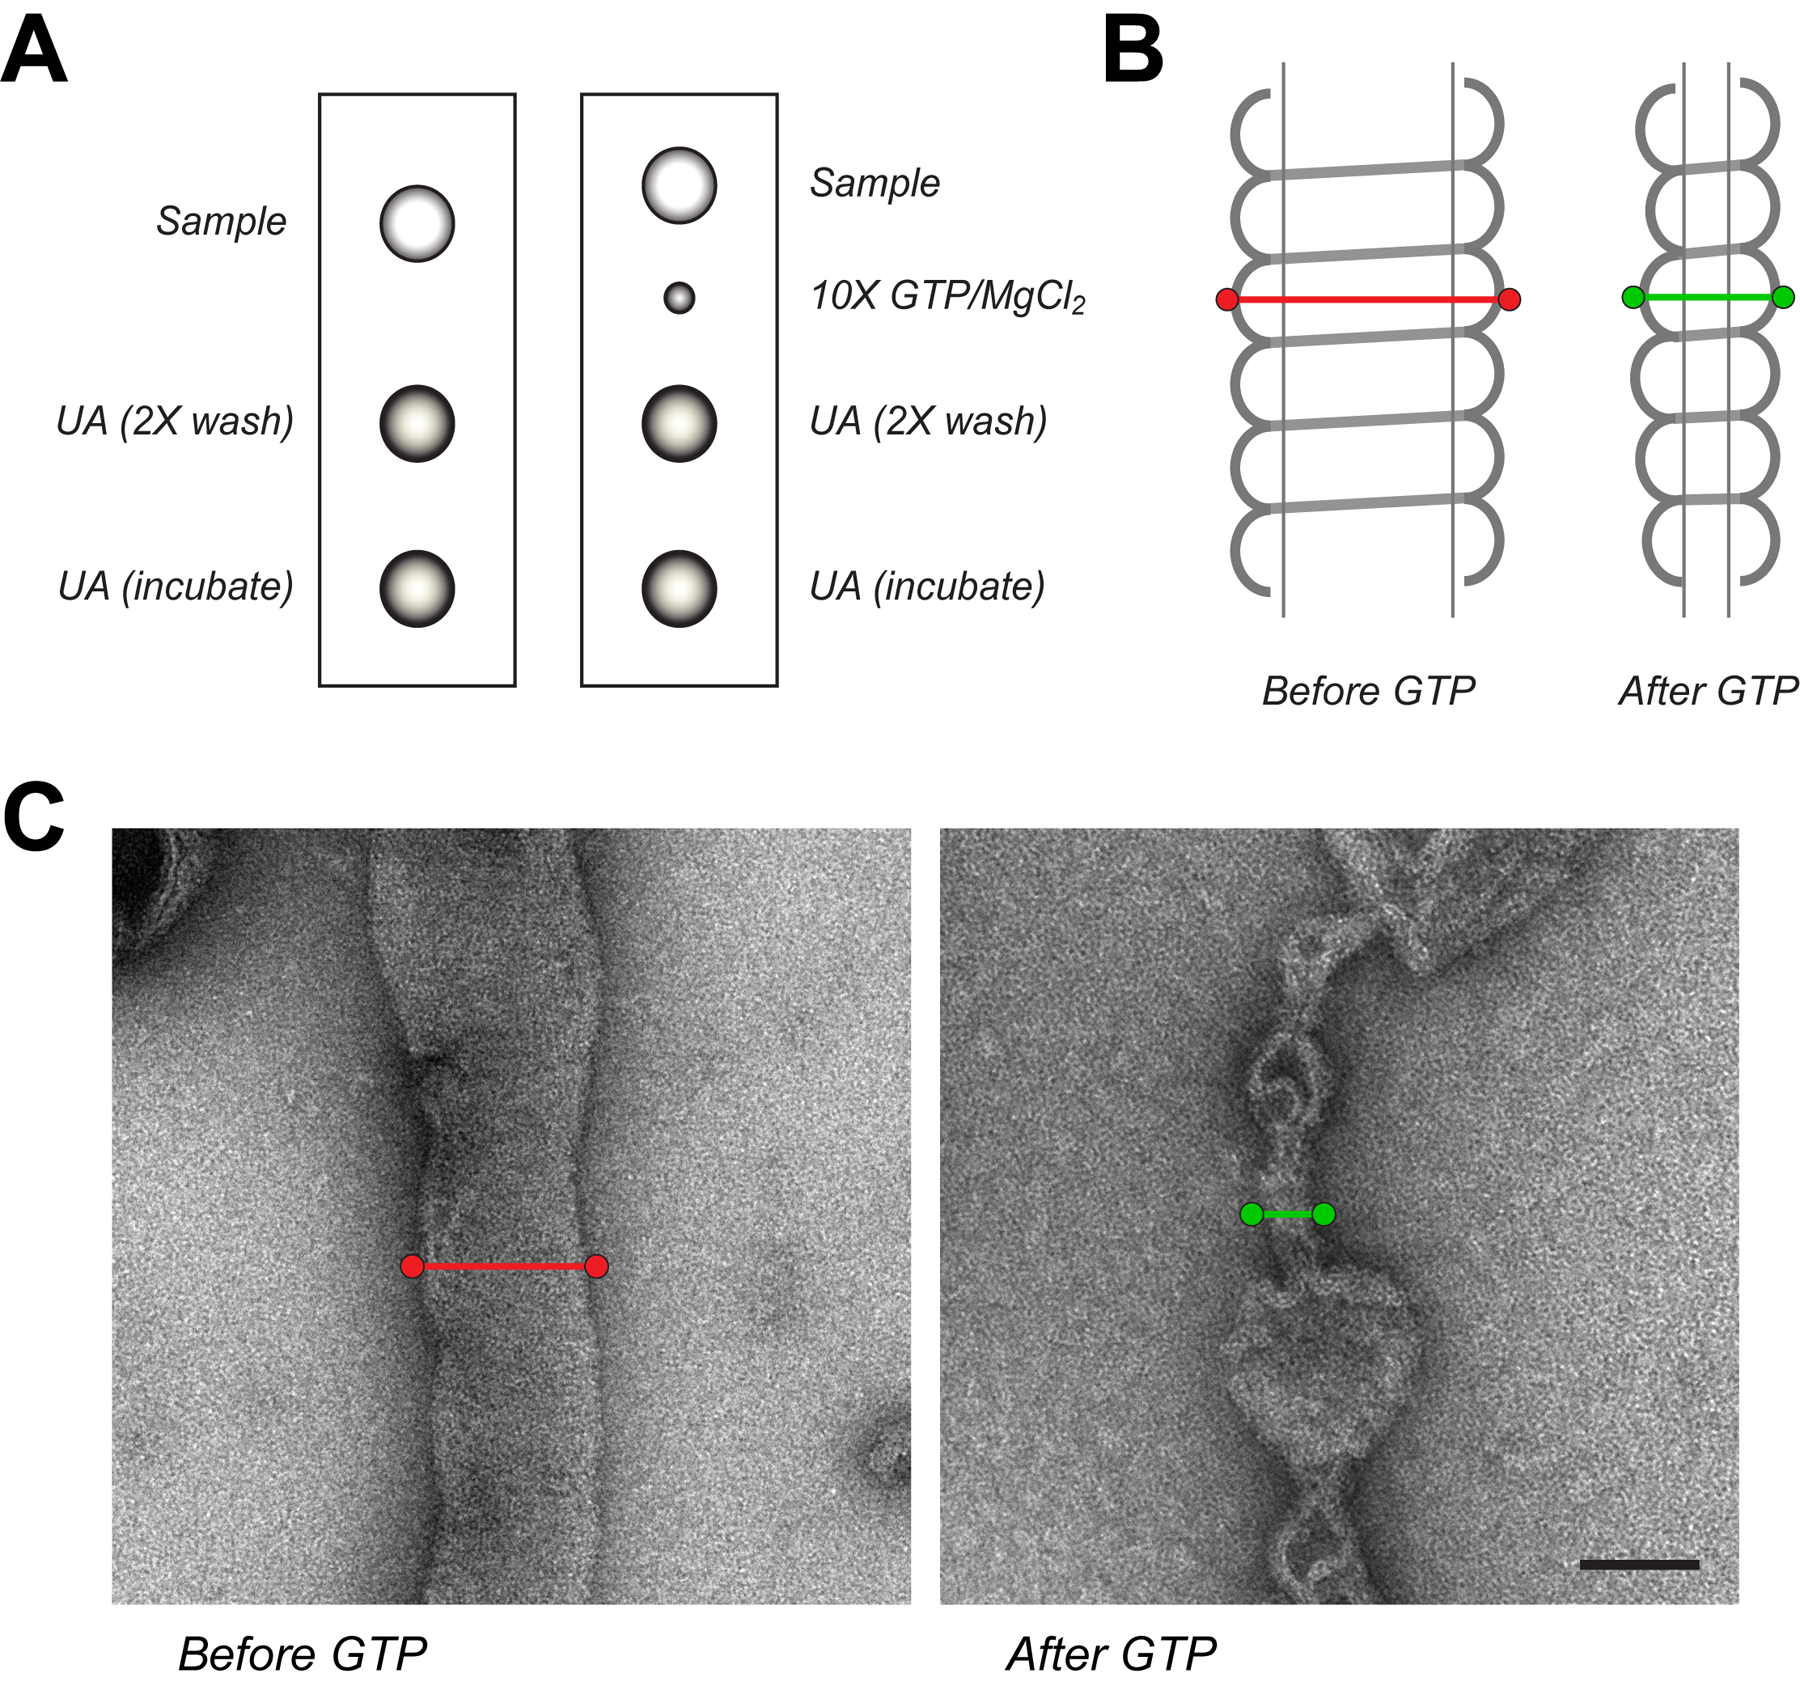
Figure 2. Visualizing Drp1 tubulation by EM.

(A) To prepare negative stain grids, a drop of sample containing Drp1-lipid tubes alone or with nucleotide is placed on parafilm with two separate drops for washes and a final incubation with 2% uranyl acetate. For assessment of nucleotide interactions at shorter time points after addition, a separate drop of nucleotide and MgCl2 (10X) is placed adjacent to the sample drop. The grid is initially placed on the sample drop and the nucleotide can be added at the desired time before stopping the reaction with stain washes and incubation. (B) Measurements of protein-lipid tube diameters are made by tracing a line orthogonal to the helical axis at the edge of detectable protein before (red line) and after (green line) nucleotide addition. (C) Representative micrographs highlight the morphological change that occurs when GTP is added to pre-decorated Drp1-lipid tubes. Scale bar, 100 nm.
