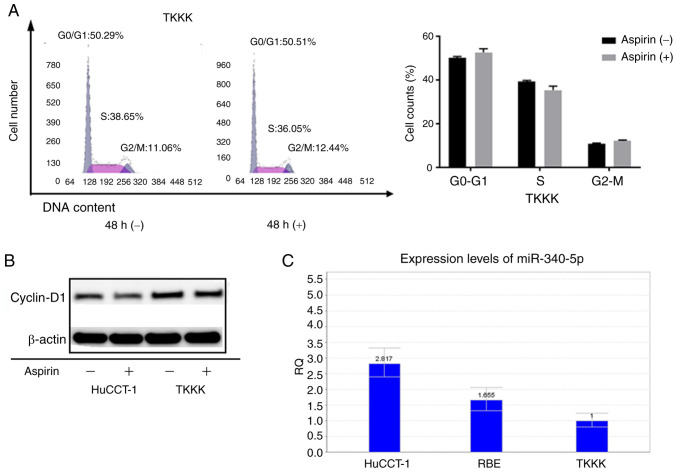
Figure 7.
Comparison of the cell cycle and miR-340-5p in aspirin-nonresponsive TKKK cells and aspirin-responsive HuCCT1 cells. (A) Left image: TKKK cells treated with or without 2.5 mmol/l aspirin and analyzed by flow cytometry to estimate the proportion of cells in each phase of the cell cycle. Right image: Graphical representation of the proportion of cells in each phase of the cell cycle. (B) Expression of cyclin D1 in HuCCT-1 cells and TKKK cells after 48 h of aspirin treatment. (C) Relative quantification of miR-340-5p in cholangiocarcinoma cell lines.

