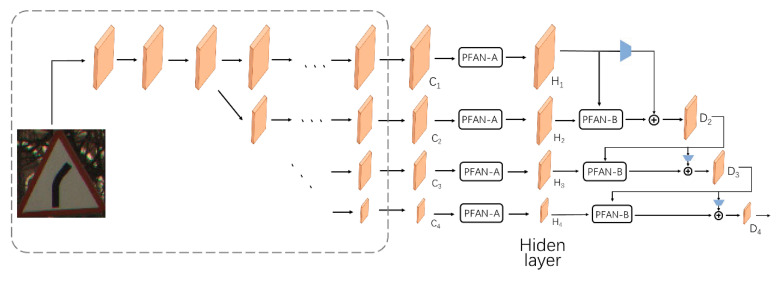
Figure 5.
The framework of the PFAN for image classification we propose. Once {C1, C2, C3, C4} has been obtained, we further generate the hidden layer Hf, and then D1, D2... progressively. “ ” denotes down-sampling implemented by 2 × 2 MaxPooling and “
 ” denotes an element-wise sum. In the dashed rectangle, the horizontal arrow represents the bottleneck or the basic block operation, and the diagonally downward arrow indicates down-sampling implemented by 2 × 2 MaxPooling. Arrows outside the rectangle only represent the data flow direction.

