
Figure 4.
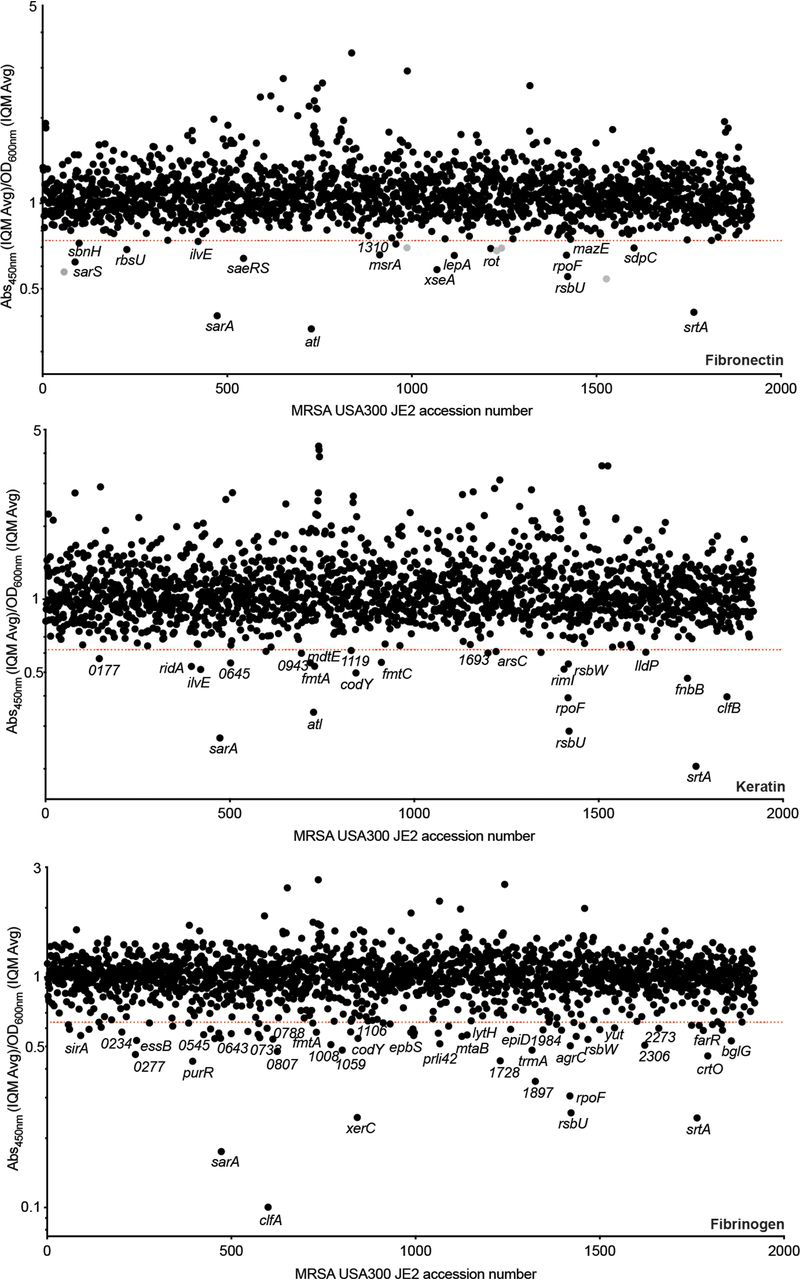
Identifying genetic loci associated with S. aureus adhesion to human-derived fibronectin, keratin, and fibrinogen, respectively. The values shown in the index plots are the ratio between the average of duplicate adhesion values (A450nm) and duplicate growth values (OD600nm) (see Fig. 3). The strains are ordered based on their associated SAUSA300 accession number (21). The screens were performed with ligand concentrations and strains sampled at the given time points depicted in Fig. 2. Strains falling below the red lines exhibited a ratio less than 4 standard deviations (fibronectin and keratin) and 6 standard deviations (fibrinogen) from the IQM (75) of the data set.