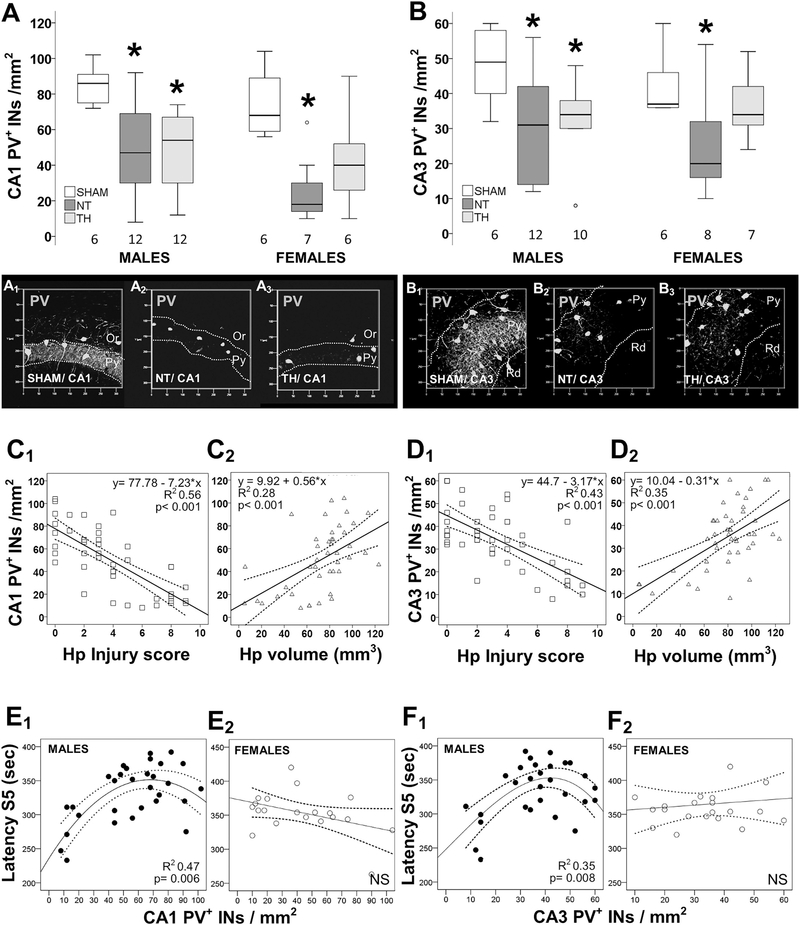
Fig. 2.
Sex-specific correlation between number of PV+INs, hippocampal injury, and flurothyl seizure susceptibility. Box and whisker plots represent the number of PV+INs per mm2 in male and female mice sham vs. HI injured treated with normothermia (NT) or therapeutic hypothermia (TH) within the CA1 (A) and CA3 (B) pyramidal cell layers (PCLs). Boxes are limited by the 25th and 75th percentiles (interquartile range, IQR) and whiskers are limited by the last data point within 1.5 times the IQR from the median (continuous line inside the box), with outliers included. Kruskal–Wallis ANOVA with Dunn-Bonferoni post-hoc testing for pair analysis was applied. *, p < 0.05. Representative transparent rendering obtained from z-stack captured at 20×/0.8 objective are shown for CA1 (A1–3) and CA3 (B1-,3) hippocampal subfield. Pyramidal (Py), oriens (Or), and radiatum (Rd) layers are labeled. The number of PV+INs showed a stronger correlation with histological scores of hippocampal injury (C1, D1) than with quantification of hippocampal atrophy (C2, D2) in both CA1 (C) and CA3 (D). The correlations between the number of PV+INs in hippocampal CA1 (E) and CA3 (F) with latency to S5 seizures are shown for male (E1, F1) and female (E2, F2) mice. The continuous lines represent the fitted line derived from regression modeling and the discontinuous lines represent the 95% confidence intervals.

