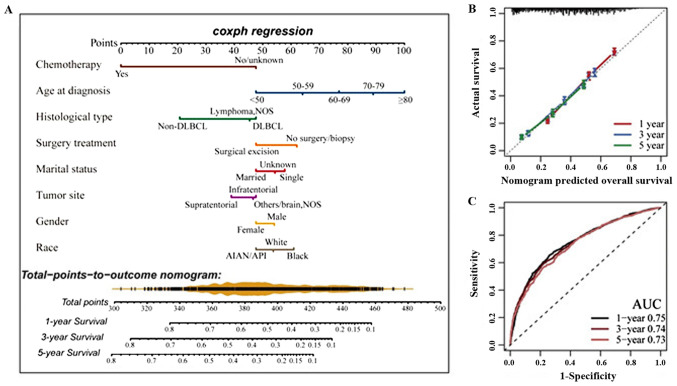
Figure 4.
Nomogram development and internal validation. (A) Nomogram construction to estimate the probability of 1-, 3- and 5-years OS for PCNSL. (B) Calibration plot of the nomogram for predicting the probability of OS at 1, 3 and 5 years. (C) Time-dependent ROC curve analysis confirmed that the nomogram had the best performance. Images taken from the study by Deng et al (136). AUC, area under the curve; OS, overall survival; PCNSL, primary central nervous system lymphoma; ROC, receiver operating characteristic.

