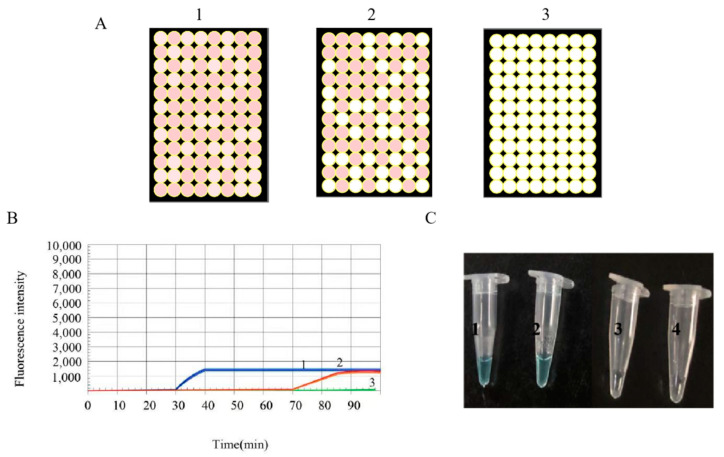
Figure 6.
(A) RT-LAMP-BART bioluminescent well images obtained when utilizing an optimized BART reagent mixture. 1 and 2 meant the target RNA template concentration from 104 to 103 copies/mL. 3 meant the negative control sample. Positive wells from 1 to 3: 96, 60, 0. Negative wells from 1 to 3: 0, 30, 96. The total well wells from 1 to 3: 96, 96, 96. (B) The same samples in (A) were tested by qPCR. (C) The same samples in (A) were tested via a colorimetric kit, wherein blue and clear correspond to positive and negative, respectively. The negative control sample was derived from the SARS-CoV-2 Orf1ab Visual RT-LAMP Kit.

