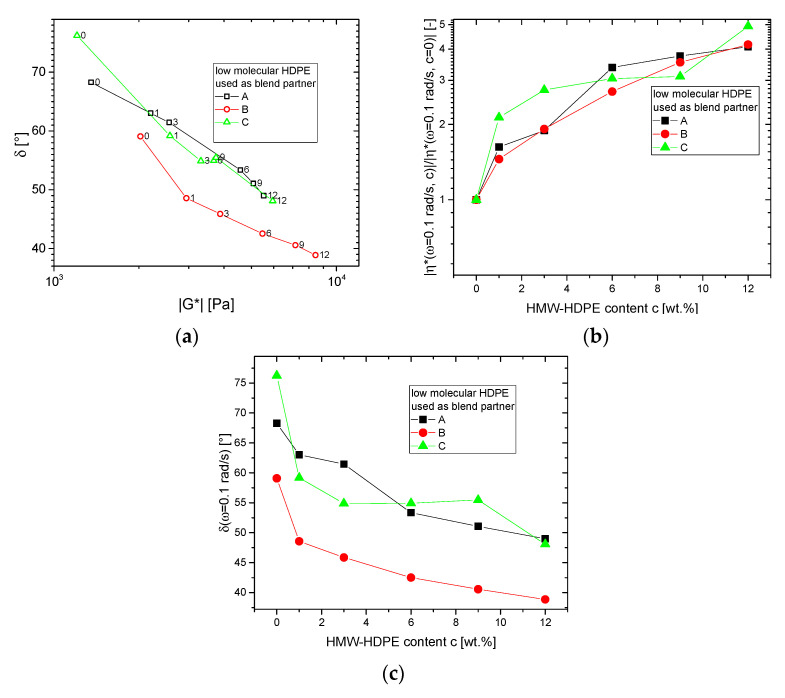
Figure 5.
Comparison of the dynamic-mechanical data obtained for the base materials and blends at ω = 0.1 rad/s and T = 150 °C. The concentration of HMW-HDPE c is denoted as a number next to each datapoint. (a) δ (|G*|)-plot, (b) viscosity change normalized to viscosity of low molecular blend partner |η*(ω = 0.1 rad/s, (c) |/|η*(ω = 0.1 rad/s, c = 0)|, (c) δ(ω = 0.1 rad/s).

