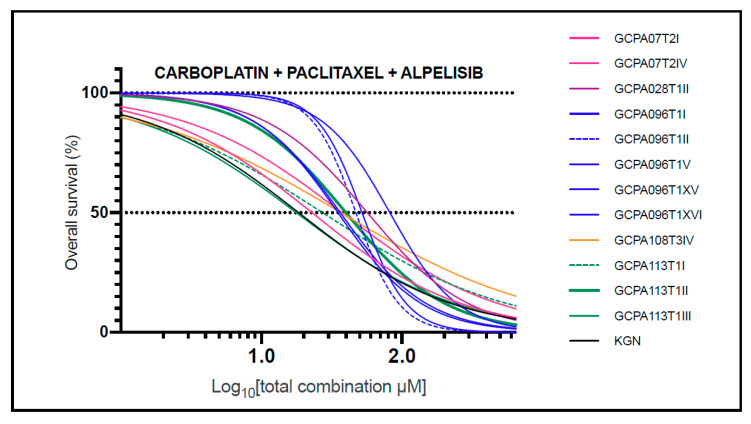
Figure 5.
AGCT cell line response to combination treatment with carboplatin, paclitaxel, and alpelisib. Pearson’s correlation coefficient (r) was used to evaluate the association between two response profiles and ranged from 0.84 to 0.99 (mean: 0.95). In 10 of 12 cell lines, the IC50 was lower than the Cmax, indicating effectiveness at non-toxic levels in vivo. Each curve represents the average response of three biological replicates and two technical replicates. The Z-factor was ≥0.8 for all drug screens. IC50: concentration needed to obtain 50% cell death; Cmax: maximum drug concentration achieved in plasma.

