Figure 1.
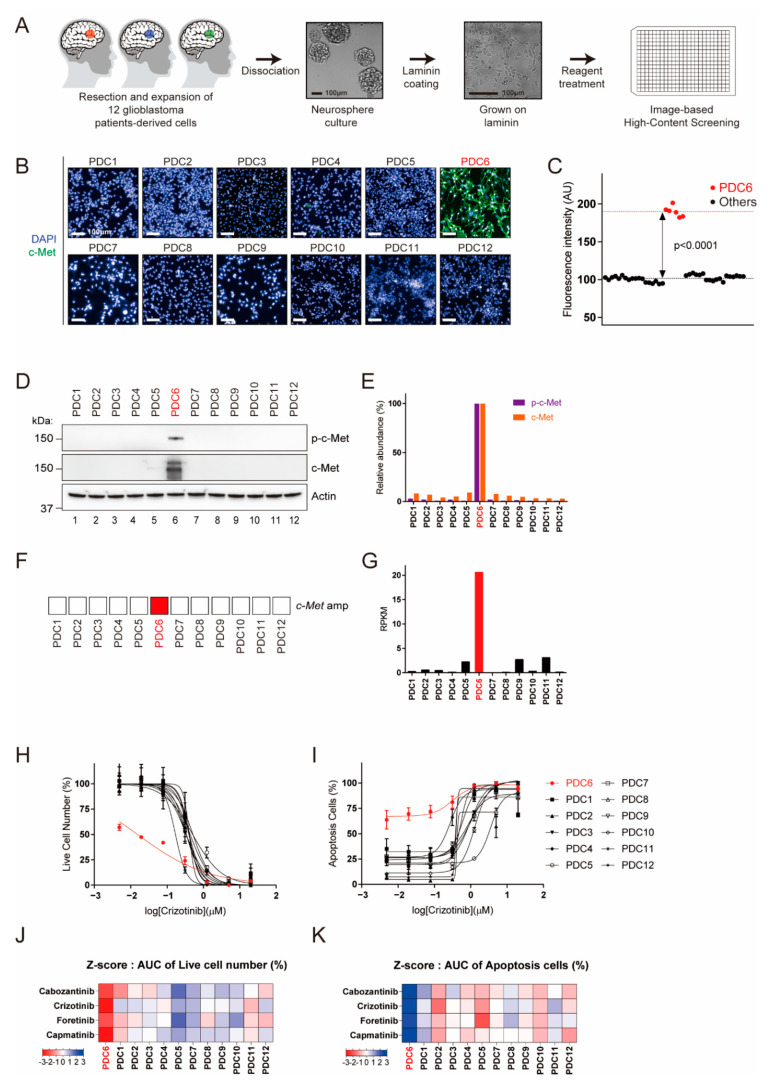
Identification of c-Met (tyrosine-protein kinase Met)-overexpressed patient-derived glioblastoma tumor cells by image-based high-content screening. (A) Schematic representation of glioblastoma patient-derived cell preparation and image-based high-content screening. Twelve patient-derived glioblastoma tumor specimens were resected, dissociated, and grown as neuro-sphere. The cells grown on laminin-coated plates were subjected to drug screening and immunofluorescence. (B) Fluorescence images of c-Met (green) and nucleus (blue) in 12 patient-derived glioblastoma cells are shown. (C) c-Met intensity measurements for 12 PDCs (Patient Derived Cells). PDC6 have a significantly higher c-Met level among the cells (p < 0.0001). (D) The p-c-Met and c-Met levels in 12 PDCs were examined using immunoblotting assay. Actin was used as a loading control. (E) The levels of p-c-Met and c-Met relative to Actin were quantified and represented in a bar graph. (F) Map of the c-Met gene amplification status. (G) Reads per kilobase of transcript per million mapped reads (RPKM) values of c-Met are shown in a bar graph. (H,I) Dose-response curve (DRC) graph of viable cell number and apoptosis cells in response to crizotinib (20 μm–4.9 nM) are shown. (J,K) Area under the curve (AUC) were analyzed from DRCs of cabozantinib, crizotinib, foretinib and capmatinib in 12 cells. AUC-based z-scores in each drug were summarized in heat maps. Color scales with z-score values are indicated.

