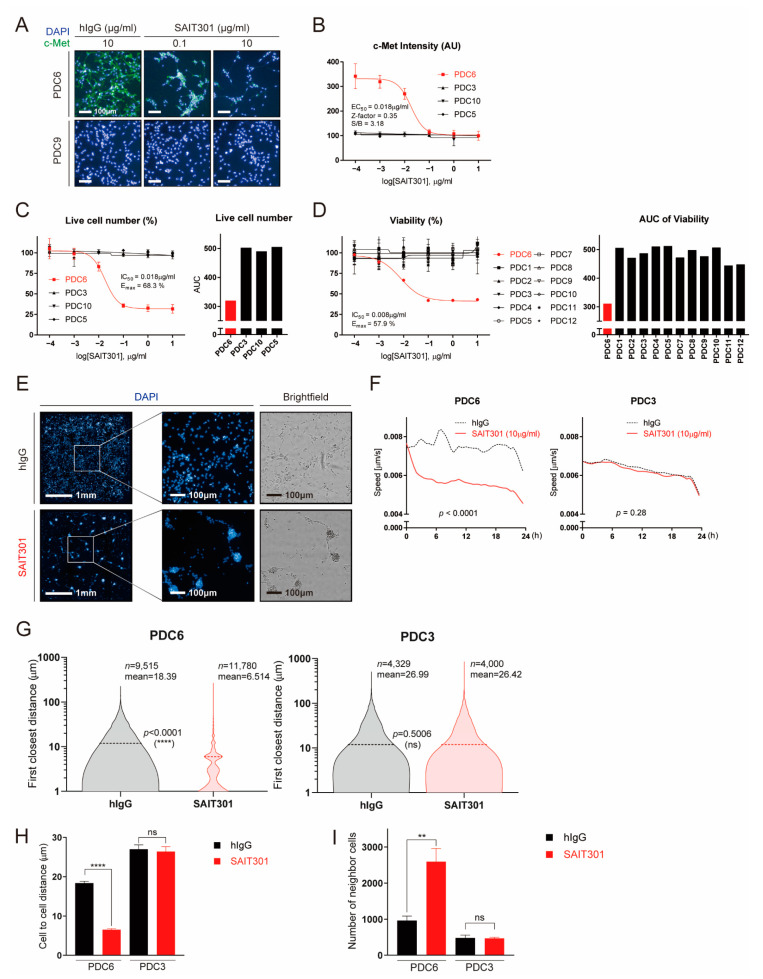
Figure 2.
Multi-dimensional high-content analyses demonstrate the effect of SAIT301 on glioblastoma patient-derived cells. (A) Representative images of c-Met (green) and DAPI (4′,6-diamidino-2-phenylindole) (blue) in PDC6 and PDC9 cells treated with control IgG (10 μg/mL), SAIT301 (0.1 μg/mL, 10 μg/mL) for 24 h are shown. (B) DRC (Dose Response Curve) graph of c-Met immunofluorescence intensity measurements in indicated cells treated with SAIT301 (0.0001–10 μg/mL) for 24 h. (C,D) A DRC of cell viability in response to SAIT301 (0.0001–10 μg/mL) for 7 days was evaluated by either image-based high-content analysis (cell number counting, C) or ATP-based assay (D). IC50 and the maximal efficacy (Emax) are indicated in the graph. Data represent mean (n = 3) and SD = 1 error. AUC values are also shown on the right sides. (E) Representative images of DAPI (10×) and their magnified images (40×) of PDC6 cells treated with or without SAIT301 (10 μg/mL) for 24 h are shown. Brightfield images are on the right sides. (F) The speed of cell movement was calculated by analyzing real-time cell images taken every 30 min for 24 h. PDC3 data are shown for comparison. (G) PDC3 and PDC6 cells treated with either control hIgG (Human Immunoglobulin G) (10 μg/mL) or SAIT301 (10 μg/mL) were analyzed at the single-cell level. The first closest distance (pixel) of single cells is shown as violin plots. Cell numbers used in analysis are indicated with the mean value and p-value. (H) Mean value of cell-to-cell distance (μm) and (I) number of neighbor cells (fold change) (****: p < 0.0001, **: p < 0.01, ns: p > 0.05, not significant).

