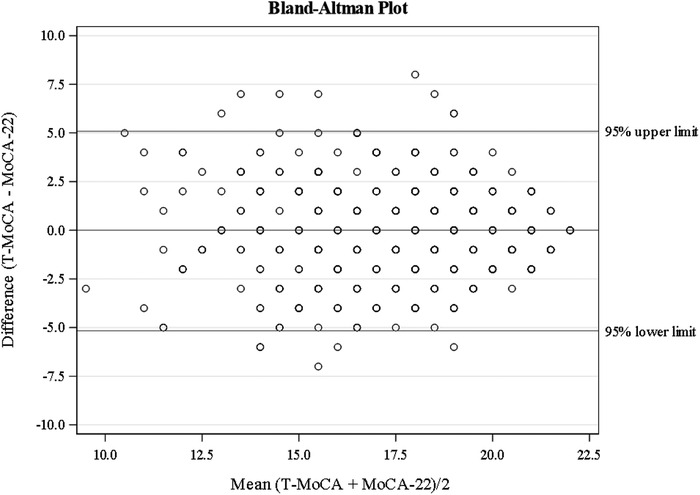
FIGURE 1.

Bland–Altman plot for examining the relationship of the difference score between the Montreal Cognitive Assessment subset (MoCA‐22) and telephone MoCA (T‐MoCA) and the average total score on both tests

Bland–Altman plot for examining the relationship of the difference score between the Montreal Cognitive Assessment subset (MoCA‐22) and telephone MoCA (T‐MoCA) and the average total score on both tests