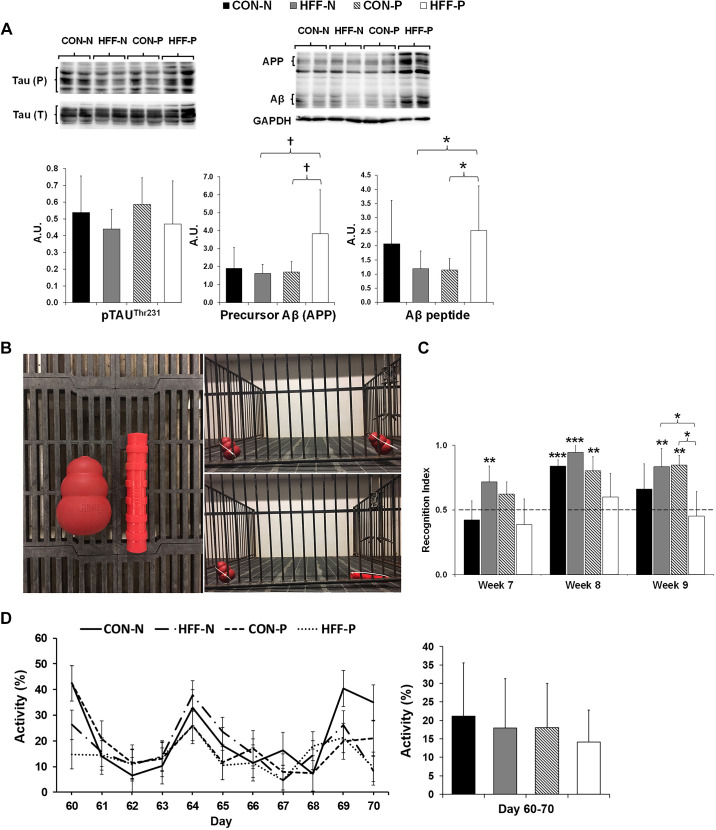
Fig. 2.
Markers of Alzheimer’s disease, cognitive function, and physical activity did not differ between control (CON) and high-fructose high-fat (HFF) diet-fed pigs. A: representative Western blots (top) and histograms (bottom) with the quantification of bands expressed as arbitrary units (AU), measuring the abundance and phosphorylation of Alzheimer’s disease hallmarks: microtubule-associated protein Tau, precursor of amyloid-β peptide (Aβ), and Aβ in frontal cortex of juvenile Iberian pigs. Histograms represent means ± SD from quantification of 6 protein bands from 3 independent Western blots, with each band representing 1 animal. GAPDH was used as a loading control. P values were adjusted for multiple testing with Tukey’s post hoc test. †P ≤ 0.1; *P ≤ 0.05. B, left: sample object used in the test is located on the left portion of the image and the novel object on the right portion of the image. Right: representative pictures showing the location of sample and novel objects during the test: learning phase (top) and memory phase (bottom). C: the recognition index (RI) was >0.5 for control (CON-N) in week 8, for high-fructose high-fat (HFF-N) in weeks 7, 8, and 9, and for CON + 6.2 × 10⁴ cfu/mL probiotics (CON-P) in weeks 8 and 9 and increased for CON-P and HFF-N as compared with HFF + 6.2 × 10⁴ cfu/mL probiotics (HFF-P) in week 9. Histograms represent the RI in CON-N (n = 4), CON-P (n = 4), HFF-N (n = 6), and HFF-P (n = 6). RI was calculated based on the formula (time spent investigating novel object/time investigating both objects). All values are means ± SD. D: pen activity, measured daily between days 60 and 70 of the study from 8:30 AM to 12:30 PM (left), did not show differences between treatments. Overall pen activity for each treatment during the 10-day interval (right). All values are means ± SD. Significant P values for 1-tailed t tests and P values adjusted for multiple testing with Tukey’s post hoc tests, are expressed as *P ≤ 0.05, **P ≤ 0.01, and ***P ≤ 0.001. APP, amyloid-β precursor protein.

