Fig. 6.

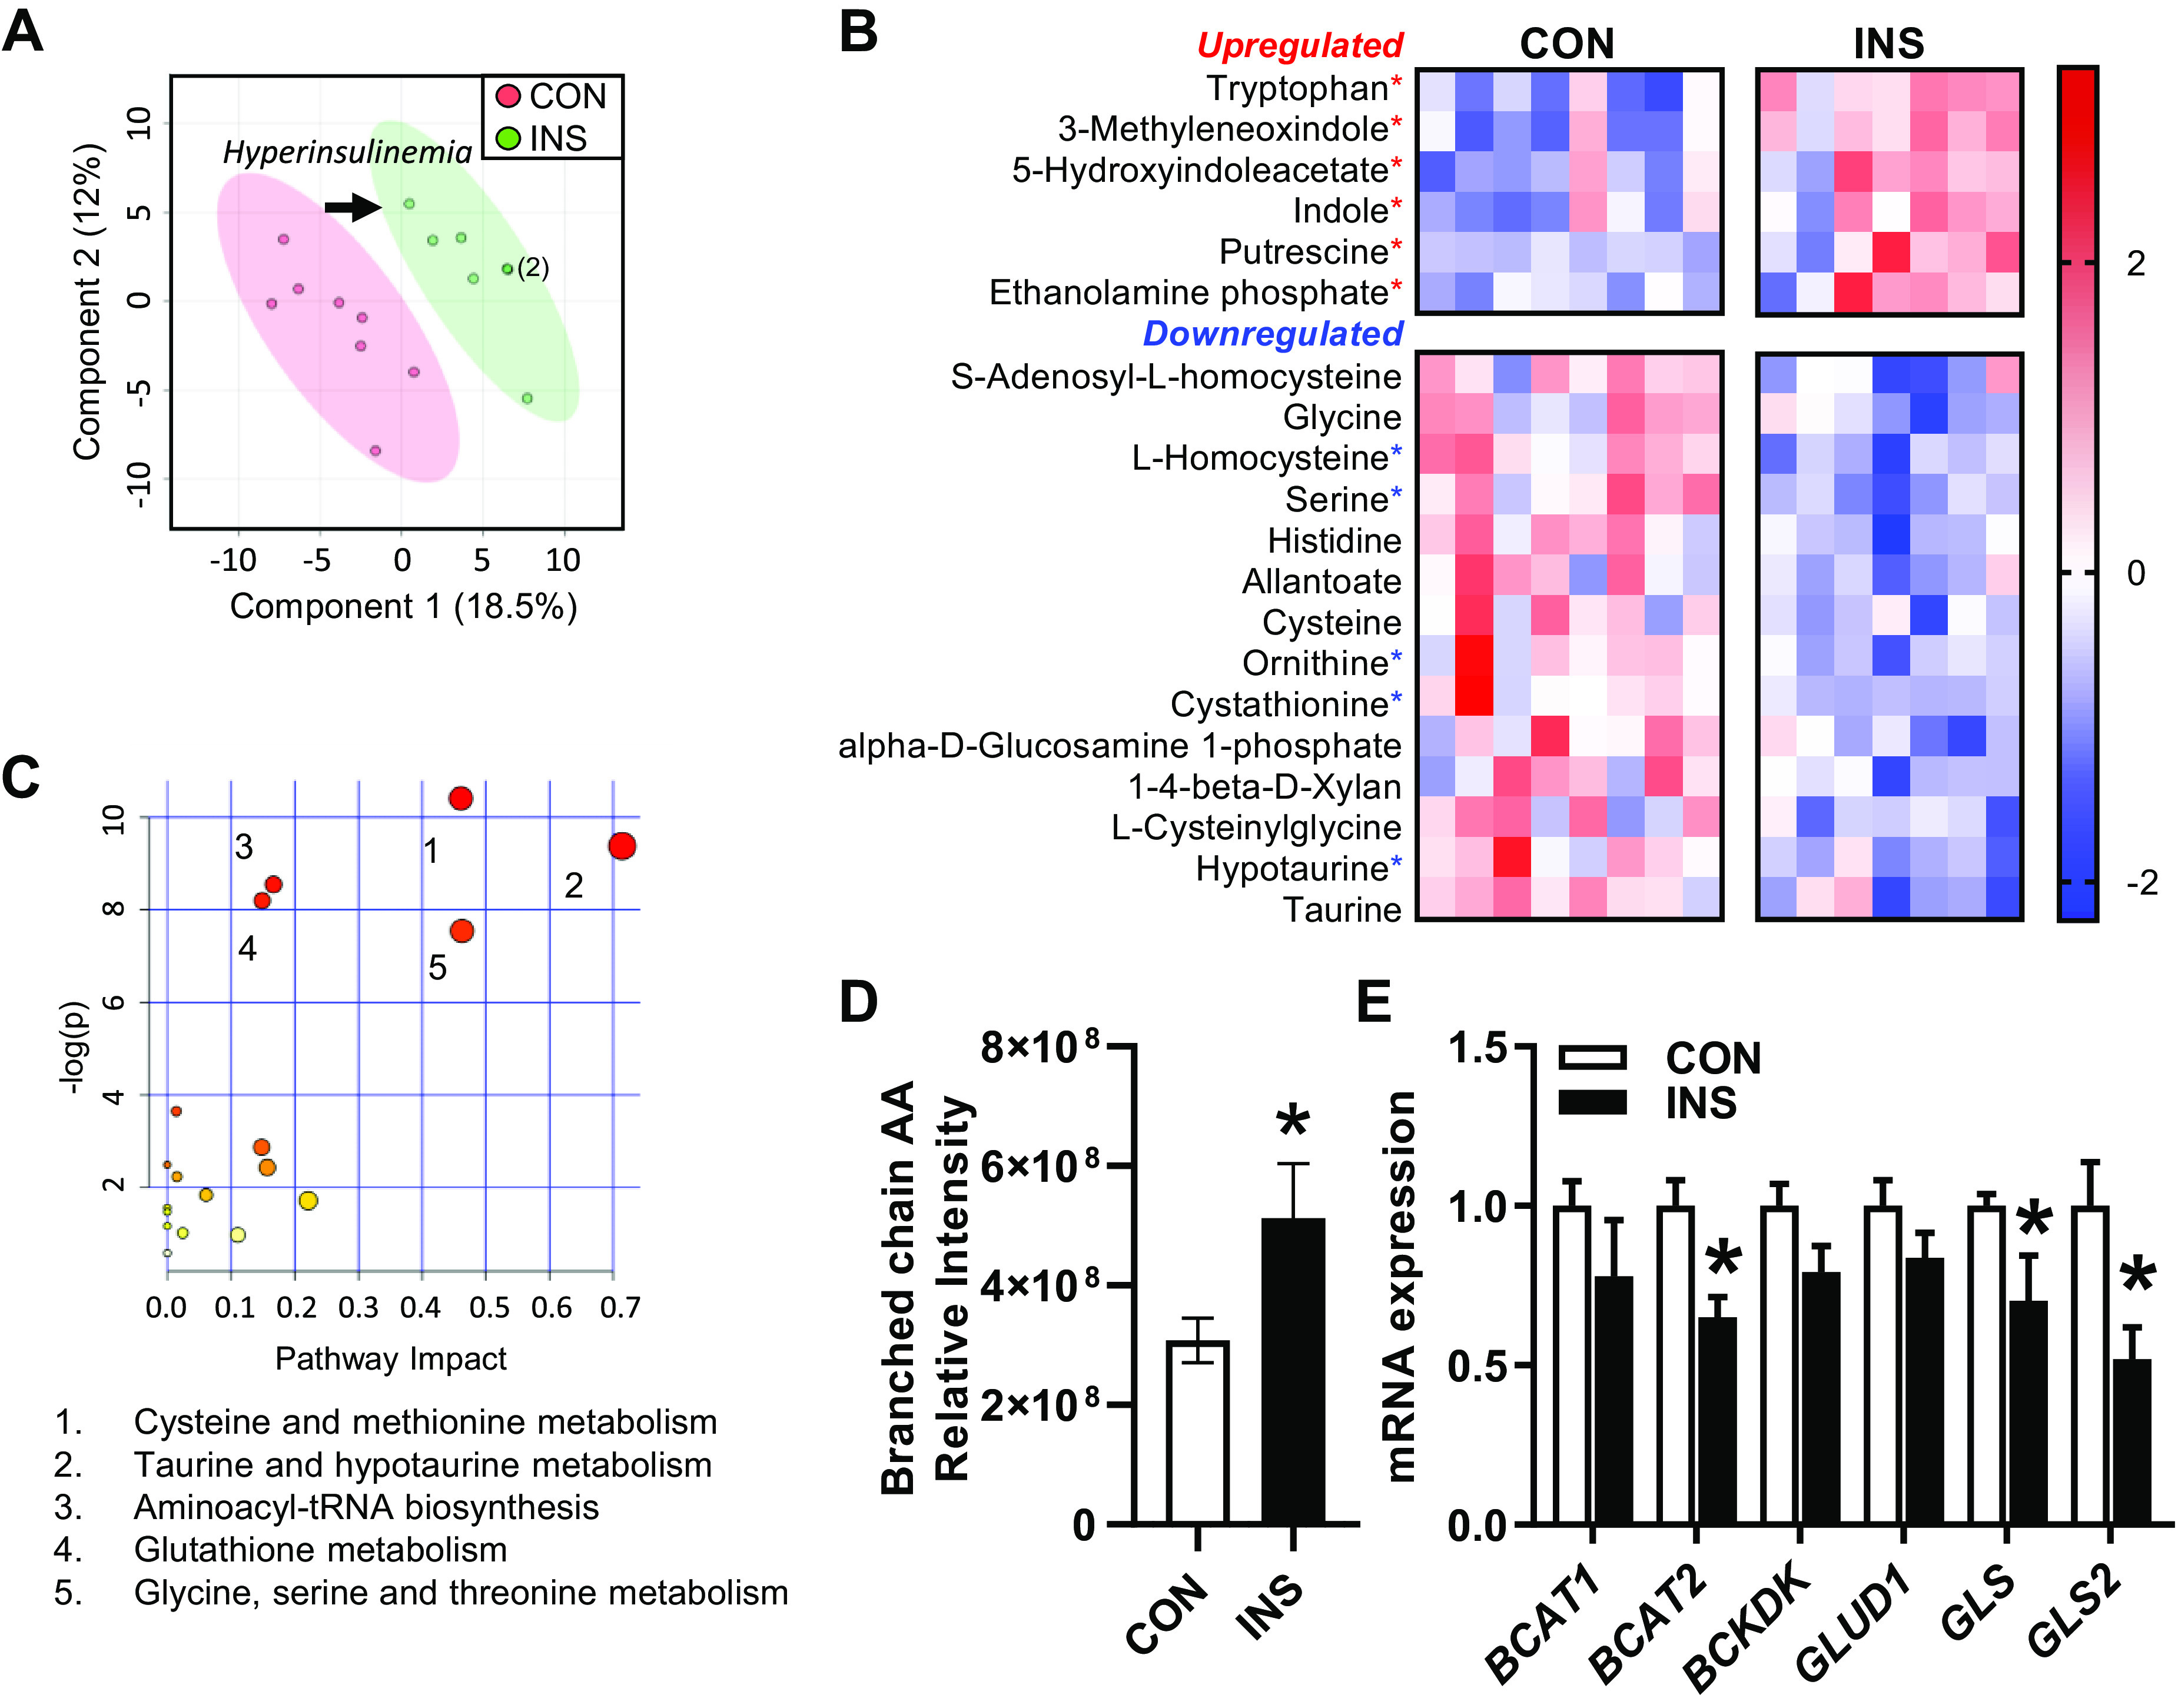
Global effect of chronic hyperinsulinemia on fetal hepatic metabolomic profile. Liver samples from control (CON) and hyperinsulinemic (INS) fetuses were subject to global metabolomics profiling. A: partial least squares discriminant analysis (PLS-DA) was used to identify metabolites with changes in abundance that defined separation of samples between the groups. Two-dimensional plot is shown. Arrow indicates shift in metabolome with hyperinsulinemia. Two samples in the INS group are overlapping as indicated by the (2). B: heatmap showing hierarchical clustering of the top 20 metabolites with the highest variable in projection scores. Metabolites that are significant by univariate analysis are indicated (*P < 0.05). Row values are normalized for each metabolite, and quantitative changes are color coded from blue (low) to red (high). C: pathway analysis enrichment results are plotted with the impact score on the x-axis and significance [−log (P value)] on y-axis. The identity of the pathways with Holm adjusted P < 0.05 are listed in rank order of significance. D: relative intensity of the branched-chain amino acids (AA; sum of Leu, Ile, and Val). E: expression of genes involved in amino acid metabolism in the fetal liver. Means ± SE are shown (n = 8 CON and 7 INS). *P < 0.05 in CON versus INS.
