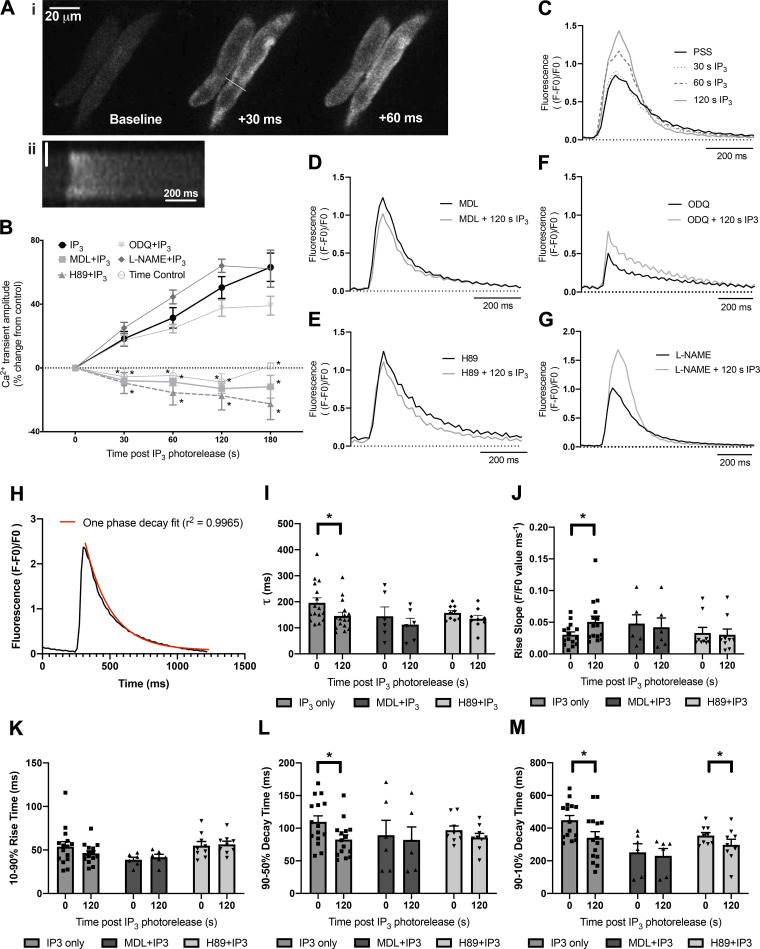
Figure 2.
The direct actions of IP3 in guinea pig atrial myocytes require adenylyl cyclases and PKA. Ai: montage to show the upstroke of a control Ca2+ transient in PSS illustrating the classical U-shaped activation pattern. Numbers indicate time in ms from start of calcium transient upstroke. Aii: pseudolinescan image generated across the line drawn in Ai to show the U-shaped calcium transient seen in guinea pig atrial myocytes. Vertical scale bar indicates 5 µm. B: summary data to show cellular responses to IP3 photorelease (0.5 µmol/L caged-IP3/PM loaded for 1 h) in isolated guinea pig atrial myocytes under control conditions (n = 16) and in the presence of 1 µmol/L H89 (n = 9) to inhibit PKA, 3 µmol/L MDL (n = 6) to inhibit adenylyl cyclases, 10 µmol/L ODQ (n = 10) to inhibit soluble guanylyl cyclase, and 100 µmol/L L-NAME (n = 4) to inhibit nitric oxide synthase. *significant difference in comparison to IP3 photorelease alone (P < 0.05, ANOVA with Dunnett’s post hoc test). C: representative Ca2+ transient response to photorelease of IP3 in PSS under control conditions and at indicated timepoints after photorelease. D–G: representative Ca2+ transients under control conditions and 120 s after photorelease of IP3 in MDL (D), H89 (E), ODQ (F), and L-NAME (G). H: representative Ca2+ trace showing transient decay period fitted using one phase decay equation. I–M: comparison of time constant of decay (τ) (I), maximum rise slope (J), 10%–90% rise time (K), 90-50% decay time (L), and 90-10% decay time (M) for all conditions. Data plotted as means ± SE, *P < 0.05. IP3, inositol trisphosphate; IP3/PM, membrane-permeant caged IP3; PSS, physiological salt solution.

