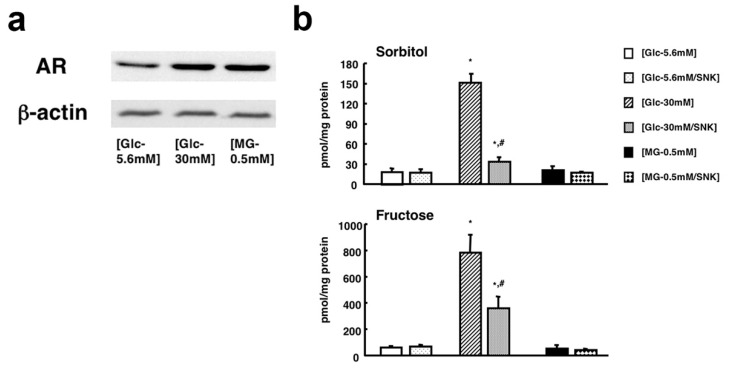
Figure 4.
(a) High-glucose- and MG-induced upregulation of AR by Western blot analysis. (b) Intracellular contents of sorbitol (upper panel) and fructose (lower panel) after 7 days of exposure to (Glc-5.6mM), (Glc-30mM), and (MG-0.5mM) in the presence or absence of SNK-860 (1 μM). Values represent the mean + SEM of 6 experiments. * p < 0.01 as compared with (Glc-5.6mM) and # p < 0.01 as compared with (Glc-30mM). Modified from Sango et al., Open Diabetes J. 2008, 1, 1–11 [33] (The publisher grants us the right to reuse the figure in other publications).

