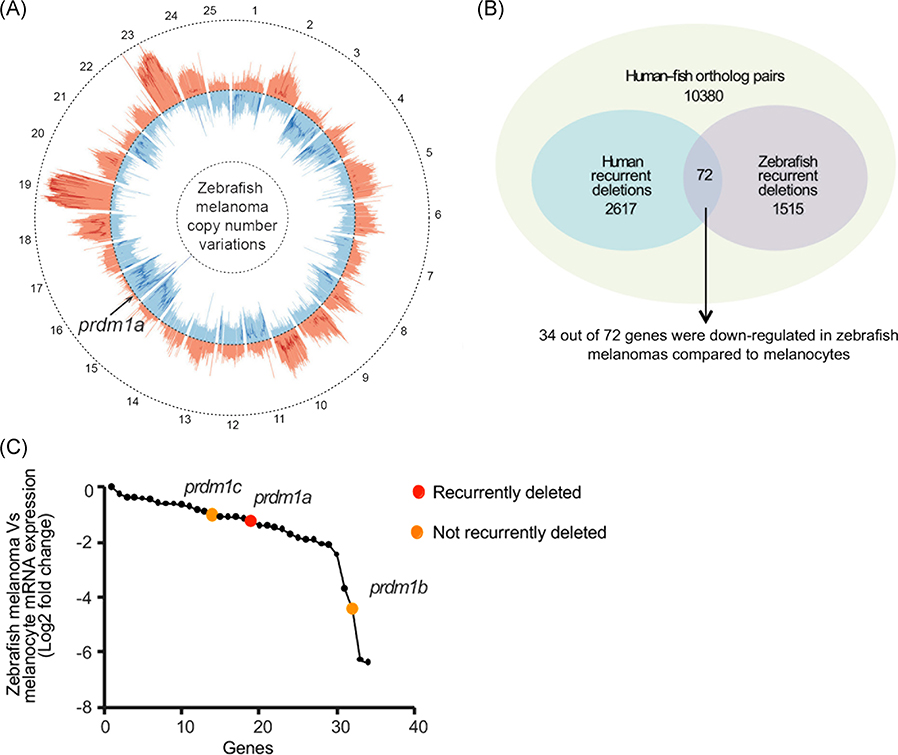
FIGURE 1.
PRDM1 is recurrently deleted in human and zebrafish melanoma. A, Circos plot displaying gene copy-number gains and losses in zebrafish melanomas as previously described.41 JISTIC G-scores are displayed as pale red shading (amplifications [minimum = 0; maximum = 1550]) and blue shading (deletions [minimum = 0; maximum = 250]). −log10-transformed JISTIC Q-values with a cutoff of 0.6 (corresponding to an untransformed Q-value of 0.25) are shown as bold red lines (amplifications [minimum = 0; maximum = 11]) and bold blue (deletions [minimum = 0; maximum = 11]). Dotted circles represent the –log10-transformed Q-value of 0 (center) and 11 (outer: amplification; inner: deletion). B, Venn diagram of orthologous genes significantly deleted in human and zebrafish melanomas from 10 380 human-zebrafish gene pairs (hypergeometric test, P value: 2.0E-16). C, Genes downregulated in zebrafish melanomas as compared with melanocytes (analyzed from previously obtained microarray dataset41). prdm1a (red dot) and its paralogs prdm1b and prdm1c (orange dots) are indicated

