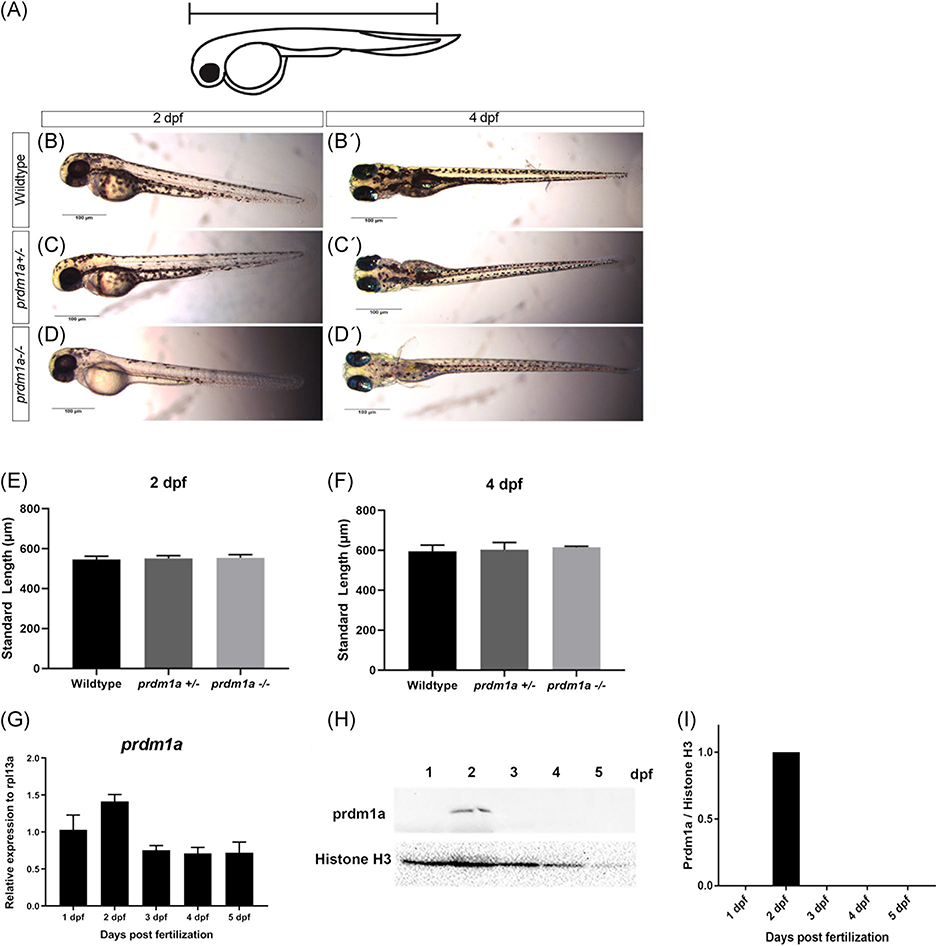
FIGURE 2.
prdm1aexpression during early development. A, Schematic showing how the standard length of the embryo was measured. Lateral images of wildtype (B), prdm1a+/− (C), and prdm1a−/− (D) at 2 dpf. Ventral images of wildtype (B’), prdm1a+/− (C’) and prdm1a−/− (D’) at 4 dpf. Quantification of standard length at 2 (E) and 4 (F) dpf. Statistical analysis was performed with a one-way ANOVA. G, RT-qPCR was performed on 20 pooled embryos at each time point (n = 3 replicate experiments) for prdm1a. H, Proteins were resolved by SDS-PAGE and Western blotting for prdm1a and total H3 was performed. I, Quantification of band intensity from the Western blot (H). Relative intensity was normalized to total histone H3 for each sample. ANOVA, analysis of variance; dpf, days postfertilization; SDS-PAGE, sodium dodecyl sulfate-polyacrylamide gel electrophoresis

