FIGURE 5.
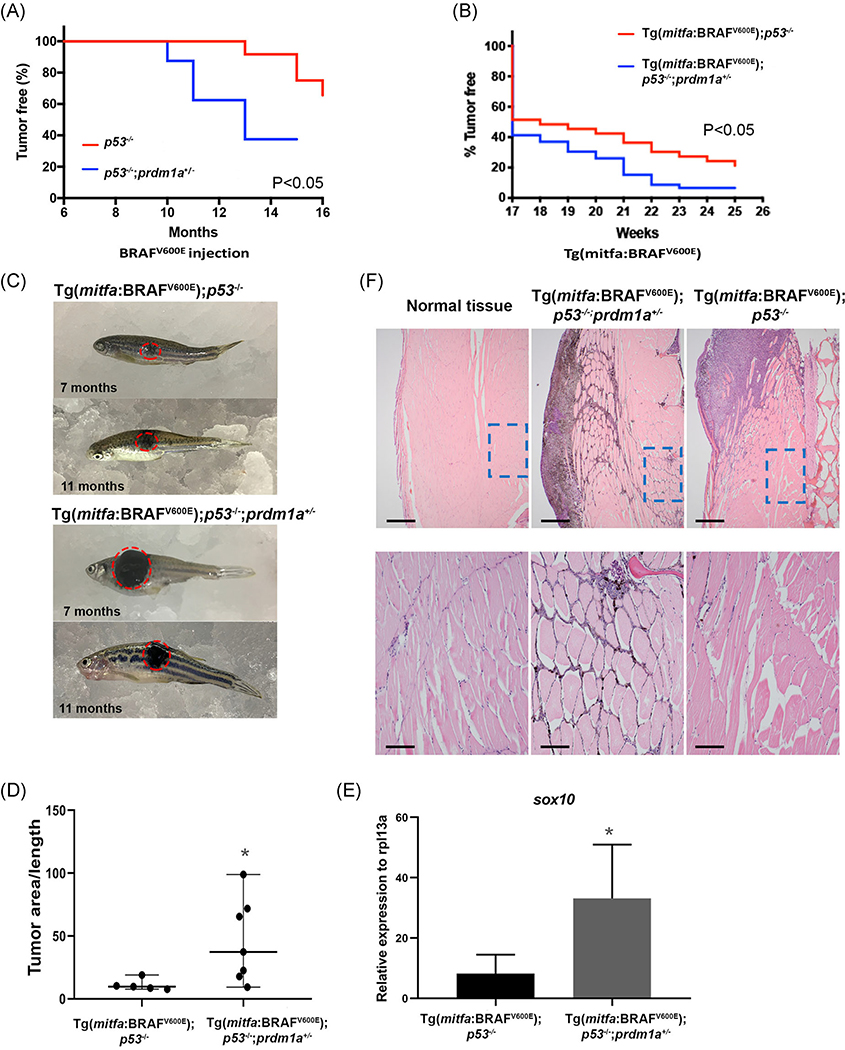
Loss of prdm1a in zebrafish accelerates tumor onset. A, Tumor-free curve from p53−/− (n = 12) and p53−/−;prdm1a+/− (n = 8) zebrafish injected with BRAFV600E construct to induce melanoma. B, Tumor-free curve from Tg(mitfa:BRAFV600E);p53−/− (n = 18) and Tg(mitfa:BRAFV600E);p53−/−;prdm1a+/− (n = 33) zebrafish. Statistical analysis for tumor-free curves was performed with a log-rank test. C, Representative images of melanoma tumors from Tg(mitfa:BRAFV600E);p53−/− and Tg(mitfa:BRAFV600E);p53−/−;prdm1a+/− zebrafish at 7 and 11 months. D, Tumor area was measured in five Tg(mitfa:BRAFV600E);p53−/− tumors and seven Tg(mitfa:BRAFV600E);p53−/−;prdm1a+/− zebrafish tumors. The area was then divided by the body length to normalize. Relative tumor area was compared using an unpaired, Mann-Whitney U test. Error bars represent median and range. E, RNA was isolated from dissected tumors and RT-qPCR was performed for sox10. Expression was compared using an unpaired, Mann-Whitney U test. Error bars represent mean ± SD. *P < .05. F, H&E staining of size-matched tumors for Tg(mitfa:BRAFV600E);p53−/−;prdm1a+/− (7 months) and Tg(mitfa:BRAFV600E);p53−/− (9 months) zebrafish compared to normal skin. Upper panels show ×40 magnification. The lower panels are zoomed into ×200 magnification. H&E, hematoxylin and eosin stain; SD, standard deviation

