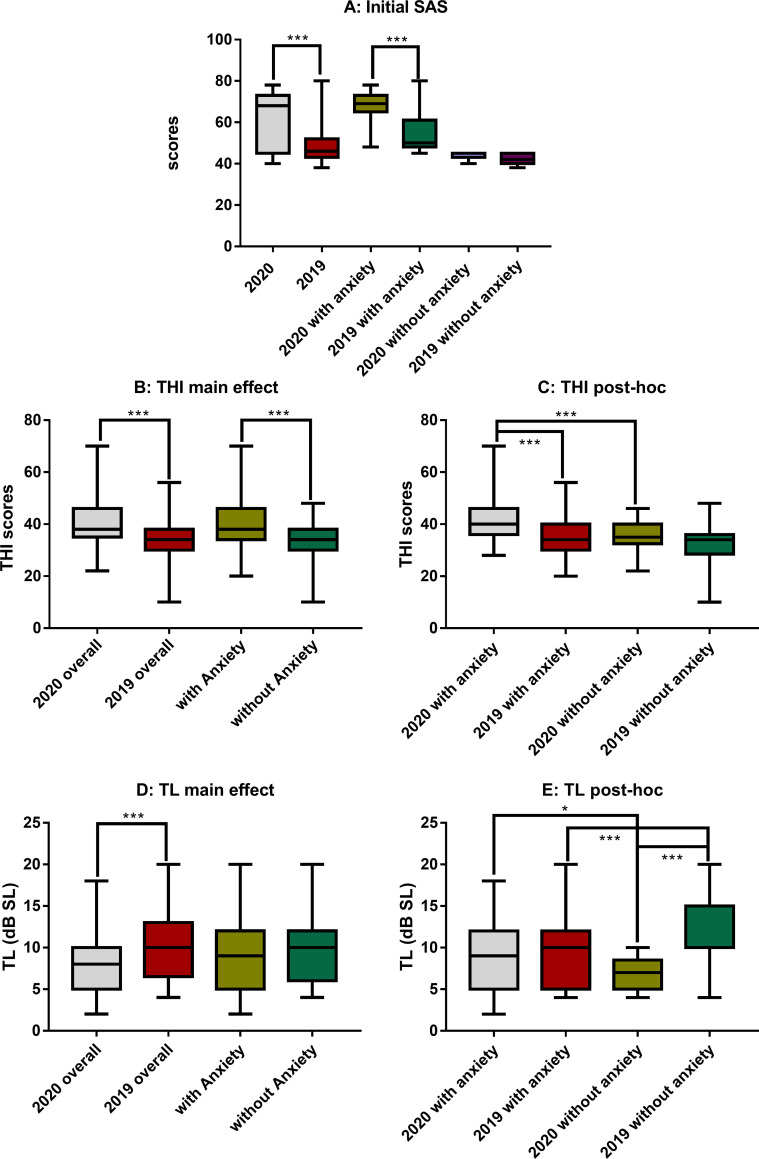
Fig 2. Comparisons of initial SAS, THI scores and TL between years and subjects with and without anxiety.
A: SAS showing a significant difference between years and between the subgroups within the two years. B and D: The differences in THI and TL as the result of the two main factors—year and anxiety. C and E: Post-hoc comparison on THI and TL showing the difference within the factors of year and anxiety respectively. Within 2020, subjects with anxiety appeared to have a significantly higher THI and TL; no difference was seen in THI between anxiety and non-anxiety subgroups within 2019, while a higher TL was seen in non-anxiety subgroup within 2019. THI: tinnitus handicap inventory, SAS: Zung’s Self-Rating Anxiety Sale, TL: tinnitus loudness.

