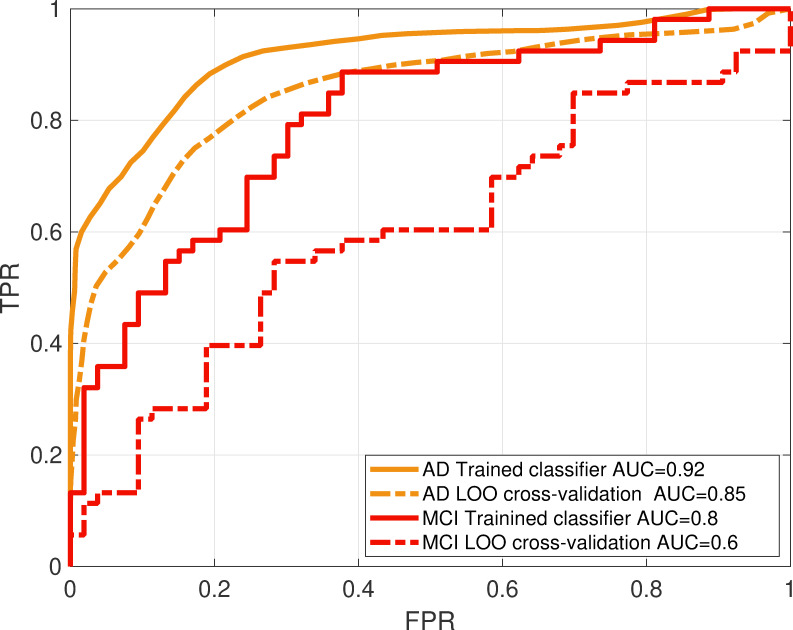
Fig 17. Classifiers performance: ROC curves (plots of true positive versus false positive rates) for the AD and MCI classifiers show the performance of the classification when the classifier is tested on the training data (solid line) and tested after LOO cross validation (dotted lines).
The area under the curve (AUC) for each classifier shows the performance compared to chancel level (AUC = 0.5).

