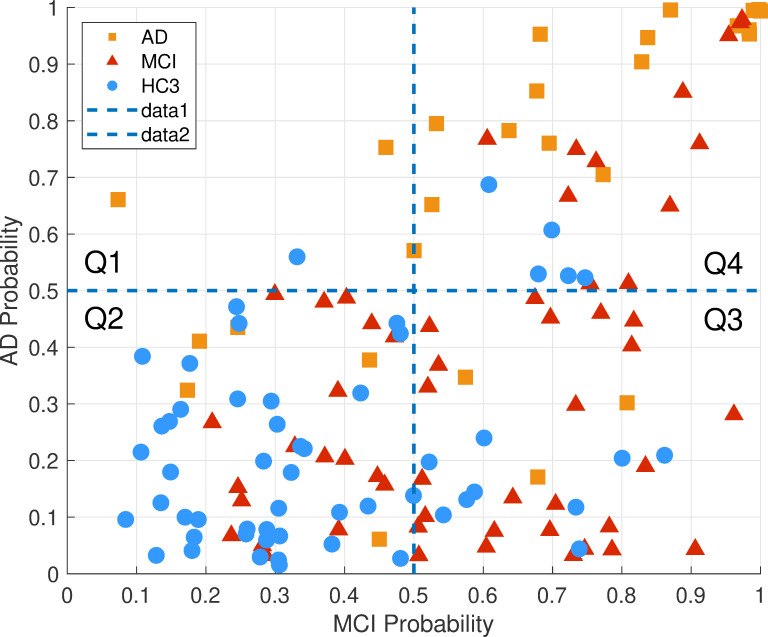
Fig 18. Classifiers between-group cross validation: The AD and MCI classifiers were tested on both the MCI and AD groups as well as the age matched HC3.
AD probability and MCI probability indicate the posterior probabilities of AD and MCI classifiers, respectively. The probability space is divided into 4 quartiles where Q2 is the quartile with little or no cognitive decline, Q3 is the quartile with possible mild cognitive decline and Q4 is the quartile with highest cognitive decline. The hypothetical trajectory of cognitive decline in this probability space is likely passing through Q2, Q3 and Q4.

