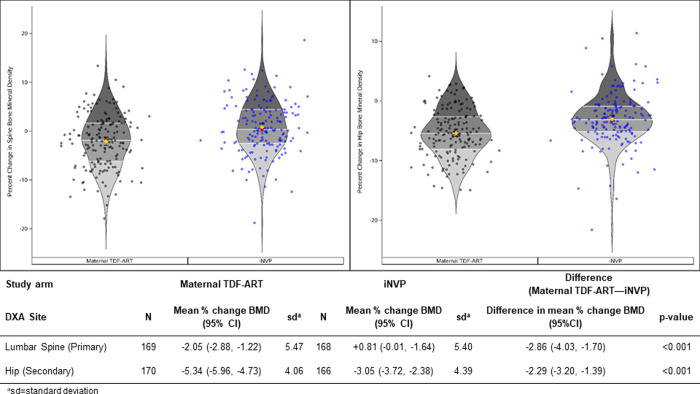
Fig 2. Percent change in bone mineral density from postpartum week 1 to week 74 at spine and hip.
Data points and the distributions are summarized with violin plots. Each violin plot presents density, along with horizontal lines indicating quartiles, a red circle for the median and a diamond for the mean (with whiskers for the 95% CI). Individual data points are superimposed on the violin plot.

