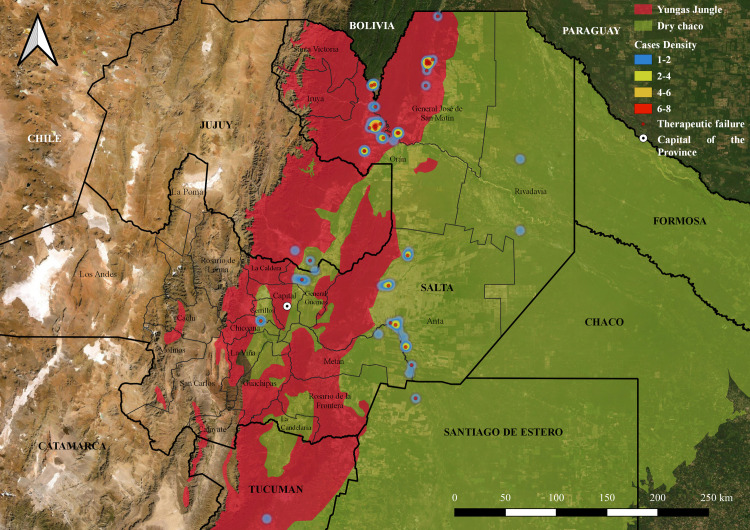
Fig 2. Geographic clustering of patients.
Heat map showing the density of patients according to the probable site of infection. The density of patients is shown in a spectrum of blue (1–2 patients) to red (6–8 patients). Also, the map shows the distribution of those patients with TF. GIS software: QGIS 3.14 version, https://www.qgis.org/es/site/; Argentina Republic political division layer: Aeroterra S.A. División política de provincias de la República Argentina. 2007; Ecoregional distribution layer: Brown A, Martinez Ortiz U, Acerbi M, Corcuera J, Pacheco S. Conclusiones de la situación ambiental por ecorregiones. In: Brown A., Martínez Ortiz U., Acerbi JC M., editor. La Situación Ambiental Argentina 2005. Buenos Aires: Fundación Vida Silvestre Argentina; 2006. pp. 373–378.

