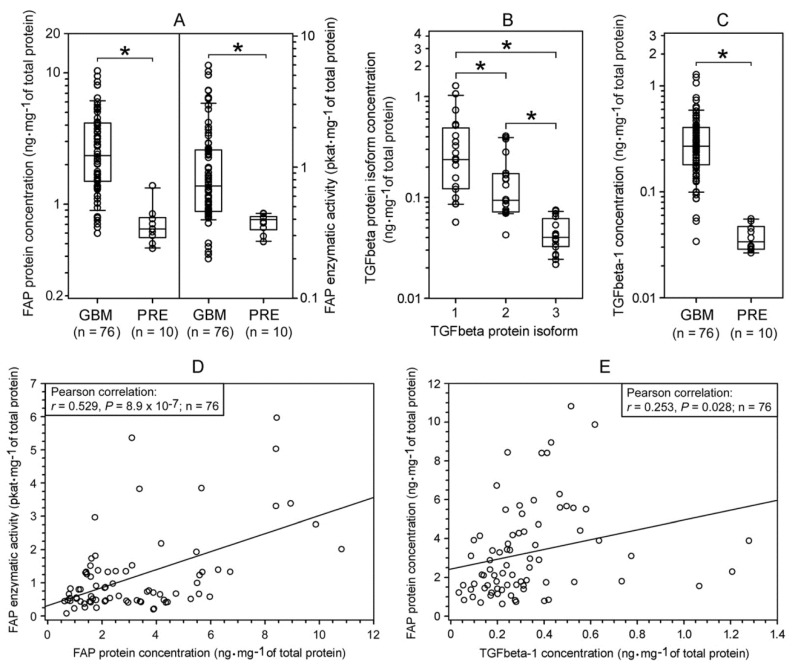
Figure 1.
Expression of fibroblast activation protein (FAP) and transforming growth factor beta (TGFbeta) in human glioblastomas (GBMs). (A) Upregulation of FAP protein (left panel) and FAP enzymatic activity (right panel) levels in GBMs as compared to pharmacoresistant epilepsy (PRE) brain tissues. (B) Differential expression of TGFbeta protein isoforms in GBMs (n = 20). (C) Upregulation of TGFbeta-1 protein level in GBMs as compared to PRE brain tissues. (D) Relationship between the levels of FAP enzymatic activity and FAP protein in GBMs. (E) Relationship between FAP protein and TGFbeta-1 protein levels in GBMs. In (A–C), the sets of individual data points (each representing the mean of measurements in triplicate) are presented as a median with the box showing the 25th–75th percentile and whiskers indicating the 10th and 90th percentile. Note the logarithmic y-axis. In (A,C), * p < 0.01, Mann–Whitney rank sum test. In (B), * p < 0.05, Kruskal–Wallis one way ANOVA on ranks.

