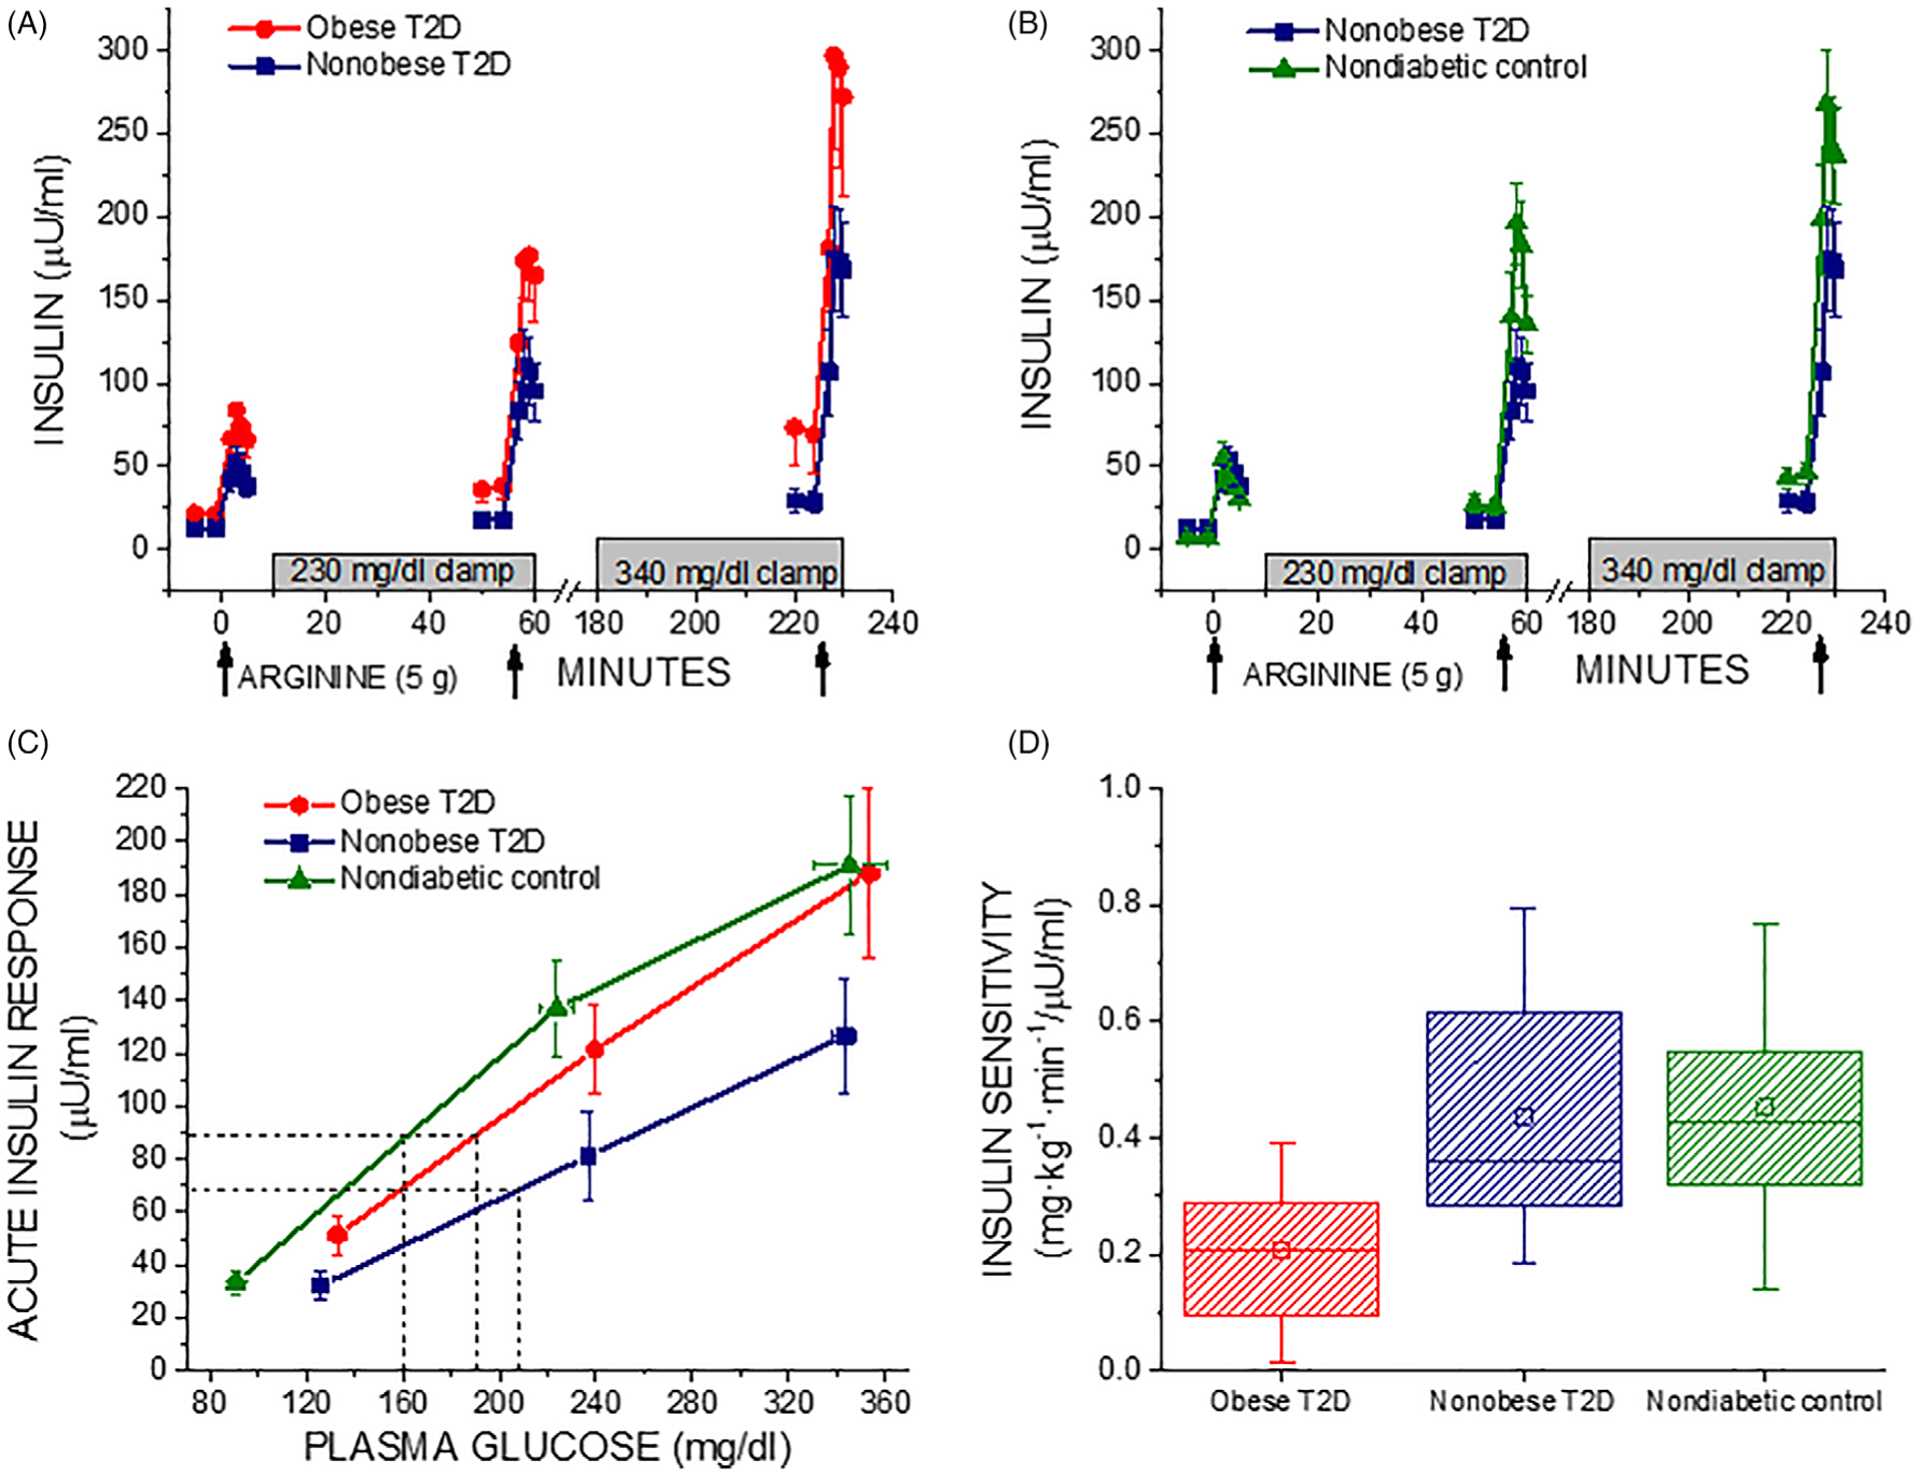
FIGURE 1.

A and B, Plasma insulin in response to bolus injections of arginine (arrows) administered under fasting, ~230 mg/dL (12.8 mmol/L), and ~340 mg/dL (18.9 mmol/L) hyperglycemic clamp conditions in obese T2D compared to non-obese T2D subjects (A) and non-obese T2D compared to non-diabetic control subjects (B). C, Acute insulin responses (AIRs) as a function of the pre-stimulus plasma glucose concentration. The glucose potentiation slope (GPS), calculated as the difference in the AIR at fasted and ~230 mg/dL (12.8 mmol/L) glucose levels divided by the difference in plasma glucose, is down shifted in obese T2D and in particular non-obese T2D (0.66 ± 0.11 and 0.43 ± 0.11) relative to control (0.79 ± 0.12; P < .05 vs nonobese T2D). β-Cell sensitivity to glucose is determined as the PG50, the plasma glucose concentration at which half maximal insulin secretion was achieved, using the y-intercept (b) of the GPS to solve the equation AIRmax/2 = GPS·PG50 + b as represented by the dashed lines, and is right shifted in T2D, especially for the non-obese T2D group (P < .05 vs control), indicating impaired β-cell sensitivity to glucose. D, Insulin sensitivity (M/I) was reduced in obese T2D compared to non-obese T2D (P < .05) that was not different from control. In A, B, and C, data are given as mean ± SE, and in D as median and IQR (box) and mean (open squares) and range (error bars)
