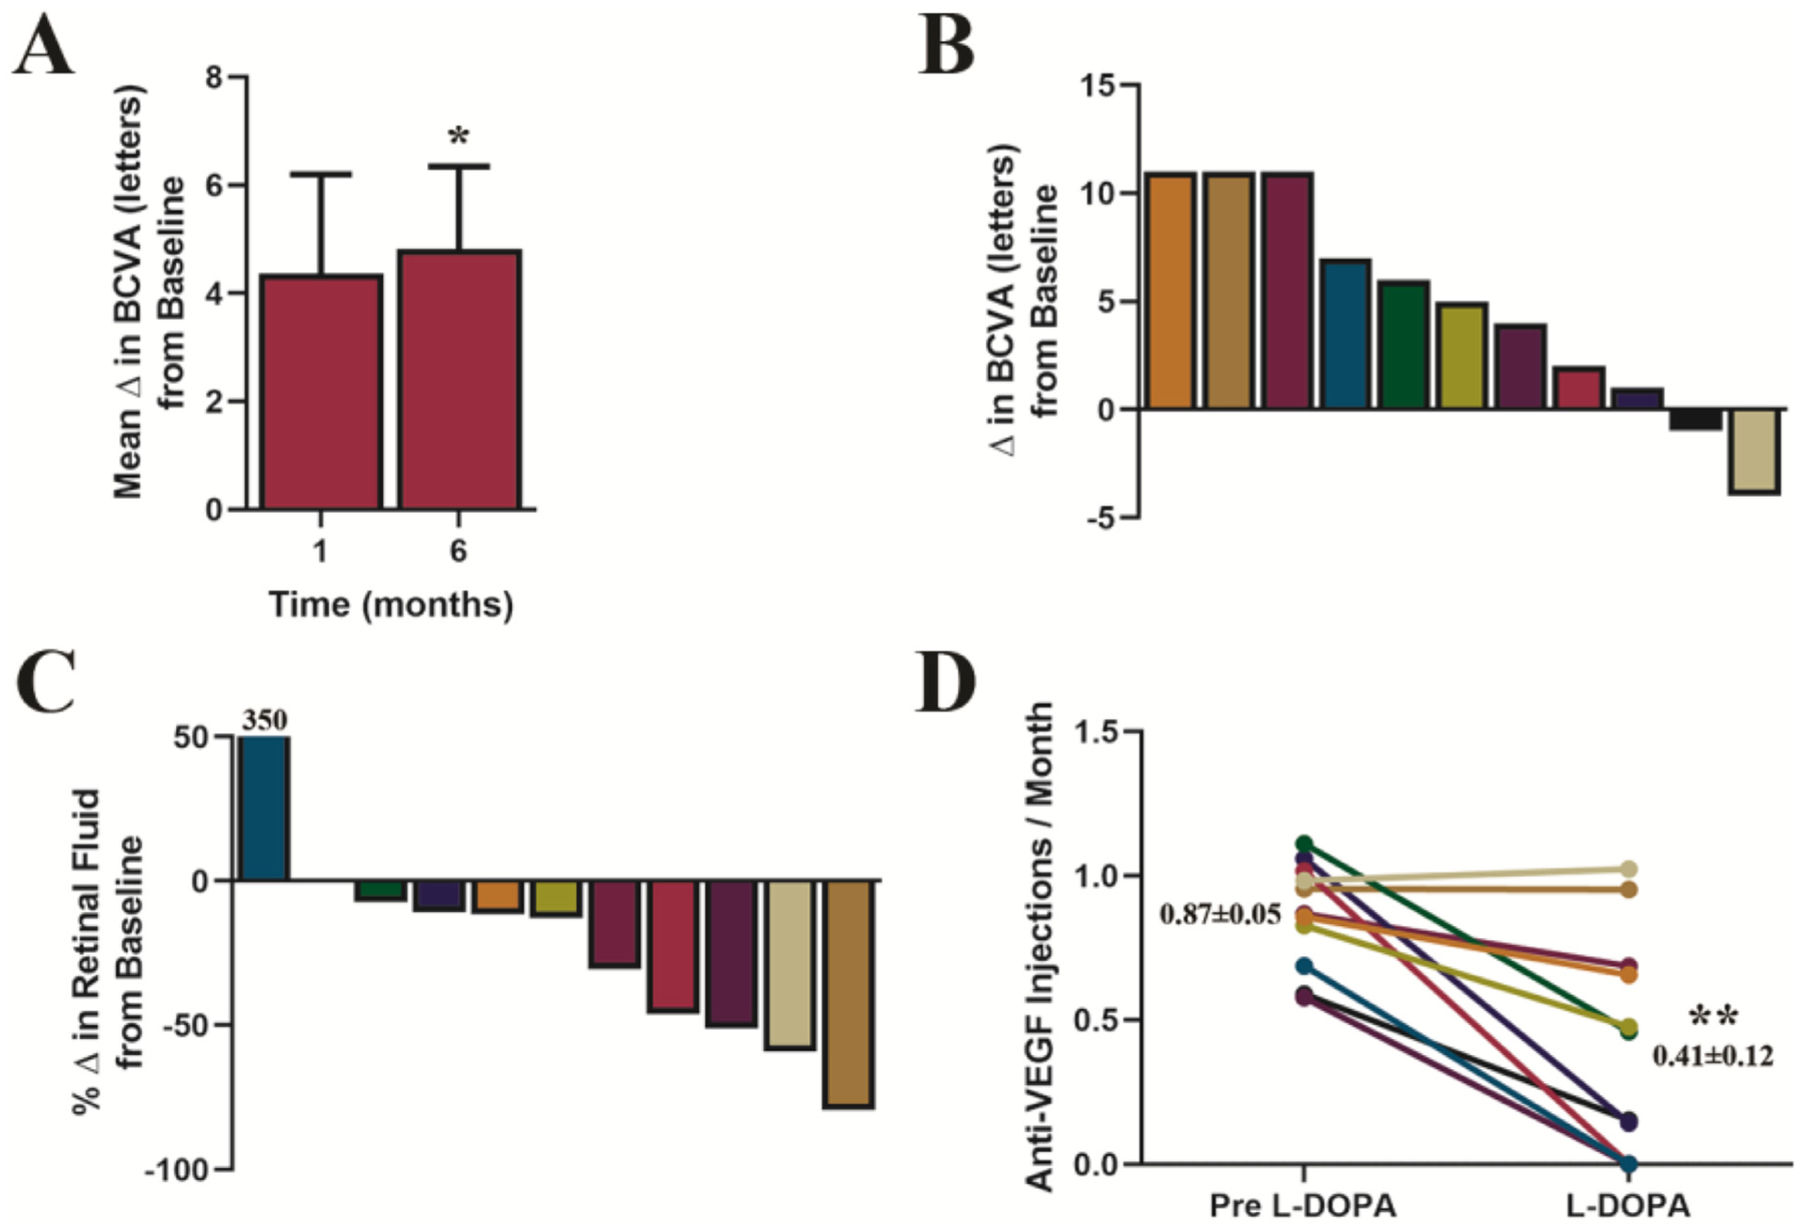
Figure 3.

Changes in best-corrected visual acuity (BCVA) and reduction in anti-vascular endothelial growth factor injections during levodopa treatment in Cohort 2. (A) mean changes from baseline in BCVA ± SE in response to levodopa treatment. Starting from a baseline mean of 41 letters (20/40), BCVA increased by 4.4 letters at month 1, P = .06; and continued to improve through month 6, BCVA increased by 4.8 letters, P = .02; paired-sample t test. (B) Illustrates individual patient changes in BCVA at month 6, (C) shows individual patient percentage changes in retinal fluid at month 6, and (D) shows individual patient anti-VEGF injection rates prior to and during levodopa treatment; insets show mean injections per month ± SE. Overall, there was a 52% decrease in the rate of required intravitreal injections, compared with injection frequency prior to levodopa (P = .002; 95% CI, 16%−67%, paired-sample t test). Statistical tests in this figure were 2-sided and adjusted for multiple comparisons with Holm-Bonferroni correction, n = 11.
