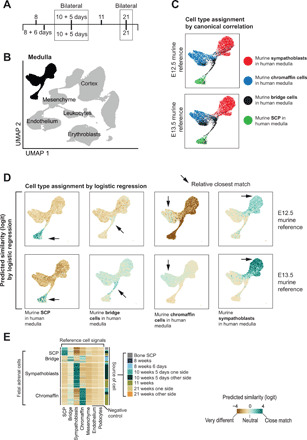
Fig. 1. Single-cell reference data from seven human fetal adrenal glands.

(A) Gestational age of fetal adrenal glands. (B) UMAP (Uniform Manifold Approximation and Projection) representation of 57,972 fetal adrenal gland cells. Medullary cells (n = 6451) are highlighted in black. (C) Cell type assignment by canonical correlation analysis as implemented in the TransferData function in Seurat. Murine medullary cell types, as defined by Furlan et al. (8), from two developmental ages [embryonic day (E) 12.5 and E13.5] were transferred to human medullary cells [black cell population in (A)] to identify human correlates (as per color legend). (D) Cell type assignment by logistic regression comparing murine medullary cell types, as defined by Furlan et al. (8) from two developmental ages (E12.5 and E13.5) with our human data [black cell population in (A)]. Colors represent the similarity score (logit scale): 0 default, positive (green) indicating strong similarity and negative (brown) strong dissimilarity. (E) Comparison of medullary cells from different gestational ages. Similarity scores are shown by color, comparing the reference week 10, day 5 adrenal gland, and extrinsic control (x axis) to medullary cell types across all time points (y axis). The annotation track to the right of the heatmap shows the sample each cell belongs to.
