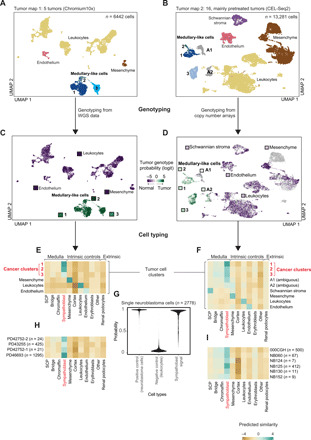
Fig. 2. Neuroblastoma single-cell transcriptomes.

(A and B) UMAP representation of 6442 (A) and 13,281 (B) neuroblastoma cells. Colors and labels indicate different cell types defined using marker gene expression. (C and D) The same UMAP representation as in (A) and (B), but here, color represents posterior probability of the cancer genotype calculated for each cell. The square next to each cluster title shows the average posterior probability for that cluster. Scores are given on a logit scale, with 0 indicating no information, positive (green) values evidence for the tumor genotype, and negative (purple) evidence for the normal genotype. (E and F) Similarity scores (logistic regression and logit scale) of the reference fetal adrenal gland (x axis) to neuroblastoma cells (y axis), containing intrinsic (noncancer cells) and extrinsic (kidney podocytes) control cell population. (G) Tumor to normal similarity score, represented as posterior probability, comparing neuroblastoma cells (positive control), leukocytes (negative control), and sympathoblasts to neuroblastoma cells. The similarity of tumor cells to sympathoblasts is comparable to the similarity of tumor cells to themselves. (H and I) Similarity of cells from the cancer clusters in (E) and (F) grouped by patient. Numbers in parentheses indicate the total number of cells in cancer clusters in (E) and (F). Only patients with at least 10 tumor cells or at least one tumor cell with validated genotype were included.
