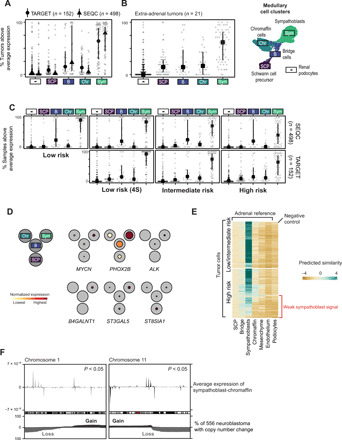
Fig. 3. Validation in clinically annotated neuroblastoma cohorts.

(A) Fraction of bulk neuroblastoma samples in TARGET (Therapeutically Applicable Research To Generate Effective Treatments) cohort and SEQC (Sequencing Quality Control) with above average marker expression. Dataset/cell type is indicated by points/x axis labels (see UMAP on right), lines indicate interquartile ranges, symbols indicate the median. (B) As in (A), but limited to tumors sampled outside the adrenal gland. (C) As in (A), but with samples split by clinical risk group (horizontal facets) and datasets (vertical facets). (D) Fetal medulla expression of GD2 synthesis genes, principal somatic, and germline predisposition genes. Black circles represent cell populations in (B), with average expression (normalized for each gene)/fraction of expressing cells indicated by color/colored circle radius. Further genes shown in fig. S5. (E) Similarity scores (logistic regression and logit scale) comparing fetal adrenal (x axis) to neuroblastoma cells (y axis) and extrinsic control (kidney podocytes). In high-risk tumor cells, a subset of cells exhibit a weakened sympathoblast signal, indicated by the red label. (F) Average expression difference between sympathoblastic and chromaffin cells versus of genomic position on chromosomes 1 and 11 (top). Positive (negative) values indicate higher expression in sympathoblasts (chromaffin) cells. The bottom shows fraction of 556 neuroblastomas with copy number gain (black) or loss (gray).
