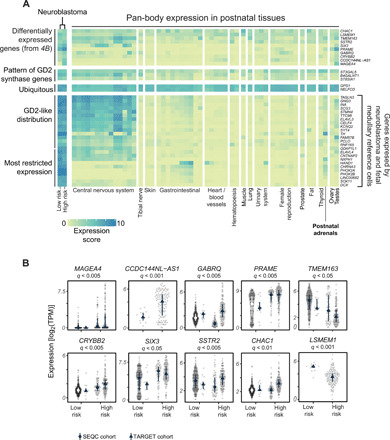
Fig. 4. Fetal neuroblastoma genes and prognostically significant neuroblastoma mRNAs.

(A) A heatmap showing the expression of GD2 synthesis genes, genes from (B), and genes used by both neuroblastoma cells and the fetal medulla (y axis) in bulk transcriptomes of normal tissues (GTEX) and high-/low-risk neuroblastomas from TARGET. The color indicates log2 of the average gene expression (TPM) for the corresponding gene and sample set. (B) Genes differentially expressed between neuroblastoma tumor cells and fetal medulla that exhibit significant risk group dependence after controlling for MYCN status and age (negative binomial test, log2FC > 1, FDR < 0.05) in TARGET dataset. For the gene listed above each panel, dots indicate expression [log2(TPM)] in individual samples, lines indicate the interquartile range, and symbols indicate the median for SEQC and TARGET datasets. Two genes (LSMEM1 and CCDC144NL-AS1) are not present in annotation used by SEQC.
