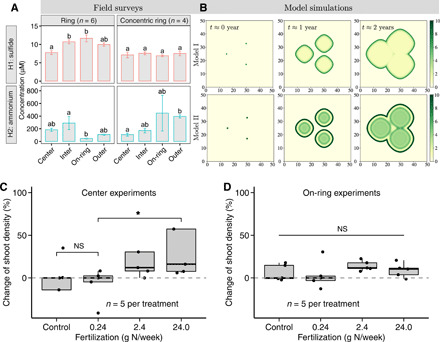
Fig. 3. Theoretical models and field experiments to confirm underlying mechanisms.

(A) Spatial variations of H2S and concentrations collected from ring-type patterns and concentric rings, respectively. Different lowercase letters above error bars represent statistically different groups identified by post hoc least significant difference tests with level of significance set at P < 0.05. The error bars indicate mean ± SE (n = 7, the numbers of sampled patches) (see tables S5 and S6 for detailed explanation of statistical parameters). (B) Theoretical simulations of models I and II, respectively, for FC pattern formation. Both models were implemented starting from the same initial conditions (three solutions). The color bars depict the plant biomass per square meter (g/m2). Left to right: Spatial patterns corresponding to each time point at yearly increments from seed colonization. The parameters used in these numerical simulations are shown in table S1. These simulations are shown over time in movies S1 and S2, respectively. (C and D) Effect of fertilization on plant growth in terms of the percentage change of net shoot density at the patch center and on the rings, respectively. Box plots depict the median (horizontal line), first and third quartiles (box), and the lowest and highest data points within 1.5-fold of the interquartile range of the first and third quartiles, respectively. Significant differences are denoted by P values using the nonparametric Wilcoxon rank sum test followed by post hoc comparison.
