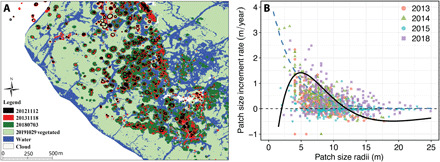
Fig. 5. Observed spatiotemporal behavior of FC patterns obtained from 2012, 2013, 2014, 2015, and 2018 satellite images and patch growth curves.

(A) The satellite images show the spots spanning over many meters in the radial direction from their centers and forming the FC patterns over time. Satellite images were taken from Google Earth of the Shanghai coastal area at coordinate 31°14′14.94″N, 121°49′38.25″E, where the dominant species is Z. latifolia within the focused area. (B) Patch size growth rate versus patch size in the radial direction, where the data were extracted from these satellite images. The growth rate reveals a stretched Allee-like effect behavior (solid black curve) rather than one based on positive feedback alone (blue dashed curve). Curves were calculated (fit lines) using the mathematical formulas f(x) = r(x − N1)(1 − x/N2) exp(−α x) (AIC = 1631.9, R2 = 0.49, P < 0.001) and a positive feedback g(x) = exp(−0.29x + 1.56) (AIC = 1361.8, R2 = 0.43, P < 0.001) with parameters r = 2.2, α = 0.2, N1 = 2.0, and N2 = 12.0. The fixed points of f(x) = 0 correspond to the critical sizes needed to survive (see table S7 for detailed statistical properties of exponential model and Allee effect model).
