
Fig. 5. NXF1 localization at the NPC is reduced upon SARS-CoV-2 infection and increased NXF1 level prevents infection.
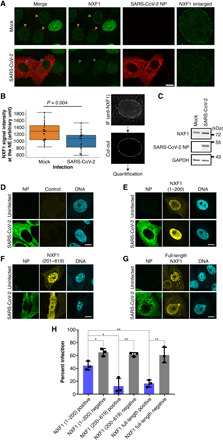
(A) Vero E6 cells were infected with SARS-CoV-2 at an MOI of 1 for 48 hours. Fixed cells were treated with digitonin (1 μg/ml) to permeabilize the plasma membrane and examined by immunofluorescence microscopy to detect NXF1 and the viral NP protein. Scale bar, 10 μm. (B) The regions of the nuclear periphery were manually selected from equatorial sections of the nuclei in the z-stack images as indicated on the right, and the signal intensities along the NE were quantified (n = 22 for mock and n = 19 for SARS-CoV-2). Individual measurements (black dots) and the summarized box and whisker plots were overlaid (left). The difference in the NXF1 intensities at the NE between the mock and the SARS-CoV-2 infection samples was tested using Student’s t test. (C) The whole-cell extracts from Vero cells mock or SARS-CoV-2 infected were analyzed by Western blotting using anti-NXF1, SARS-CoV-2 NP, and GAPDH antibodies at 48 hours postinfection. The positions of molecular mass makers are indicated. (D to G) Vero E6 cells were transfected for 24 hours with plasmids encoding full-length Flag-tagged NXF1 or the indicated mutants of NXF1 and then infected with SARS-CoV-2 at an MOI of 1 for 24 hours. Cells were examined by immunofluorescence (IF) microscopy to detect viral NP protein and Flag-tagged NXF1. Scale bars, 10 μm. (H) Percentage of infected cells (NP+) was scored for each condition. Bars represent averages of three separate experiments, and dots represent the average of each of the three independent experiments. NXF1 (1–200), n = 831 cells; NXF1 (201–619), n = 1146 cells; and NXF1 (full-length), n = 1267 cells. **P < 0.01 and *P < 0.05.