
Fig. 1. Overview of N2O fluxes from different pathways for control, wet (+25% precipitation), and drought treatments.
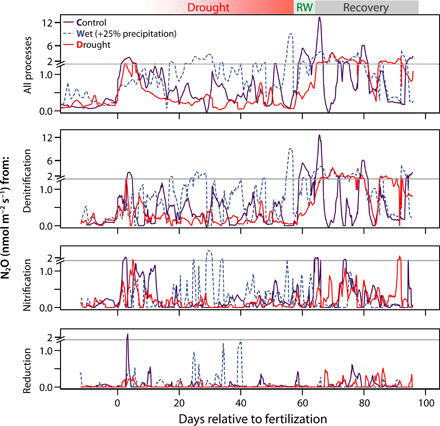
The results are the 12-hour mean of all monoliths in a treatment group (n = 4,4, and 7, respectively). Fluxes were partitioned into pathways using “correlation partitioning model” (CPM; see the “Estimation of microbial N2O production and consumption pathways: The CPM” section): “Denitrification” and “nitrification” refer to net N2O production by the respective pathways, whereas “reduction” indicates N2O consumption and production of N2 during denitrification. The time axis is normalized to the date of fertilization, as this produces the largest single change in fluxes, and time periods for drought, rewetting (RW), and recovery are indicated at the top of the figure. The y-axis scale changes at 1.4 nmol m−2 s−1 as indicated to better capture the range of observed fluxes. The scales on all y axes are equal, but the maxima differ.