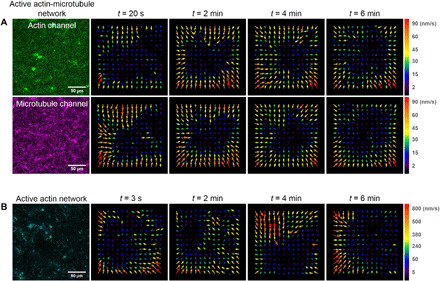
Fig. 2. PIV shows that microtubules enable organized myosin-driven contraction.

(A) Velocity vector fields of the actin channel (green, top row) and microtubule channel (magenta, middle row) of the active actin-microtubule network shown in Fig. 1 at four time points during the 6-min time series. Velocity fields were generated using PIV analysis with a lag time of 20 s. Velocity fields for both channels show consistent motion directed toward the center region of the field of view throughout the movie duration. Different arrow colors correspond to different speeds as indicated in the color scale to the right of vector fields. (B) Velocity vector fields of the active actin network (cyan), generated via PIV analysis with a lag time of 3 s, show faster and more disordered motion than the actin-microtubule network throughout the duration of the time series.
