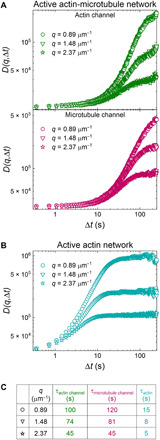
Fig. 3. DDM demonstrates that actin and microtubules in active actin-microtubule networks exhibit nearly indistinguishable contraction dynamics that are slower than in actin networks.

(A) Representative image structure functions D(q, Δt) for the actin channel (green, top) and microtubule channel (magenta, middle) of an active actin-microtubule network for wave numbers of q = 0.89 (circles, highest curves), 1.48 (triangles, middle curves), and 2.37 μm−1 (stars, lowest curves). Note the similarity between curves for the actin and microtubule channels. (B) Representative image structure functions for the active actin network for the same three q values shown in (A). Note that D(q, Δt) curves for the active actin network approach plateaus at shorter lag times than for the actin-microtubule network and, as such, have shorter decay times. (C) Decay times τ for all curves plotted in (A) and (B), determined via fitting each curve to an exponential function (see Materials and Methods). Decay times roughly correlate with when D(q, Δt) curves reach a plateau and decrease as q increases. Decay times for the actin and microtubule channels of the actin-microtubule network are in close agreement and an order of magnitude longer than those for the actin network.
