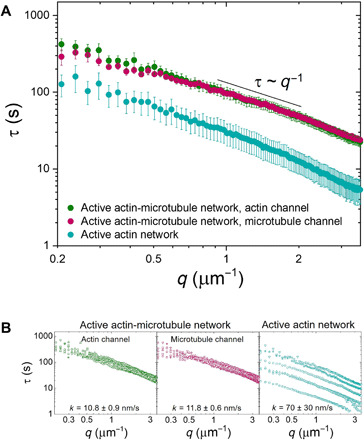
Fig. 4. DDM reveals that microtubules slow down and organize ballistic motion of myosin-driven cytoskeleton networks.

(A) Average characteristic decay time τ versus wave number q for the actin channel (green) and microtubule channel (magenta) of an active actin-microtubule network and an active actin network (teal). All curves appear to roughly follow the scaling τ~q−1 for larger q values, indicating ballistic motion. Smaller τ(q) values for all wave numbers show that the active actin network exhibits faster motion than the actin-microtubule network. (B) Individual τ versus q curves from which the average curves displayed in (A) were computed. Fitting each curve to τ~1/kq provides an effective speed k for each filament and each network, which is listed in the corresponding plots. The large spread in active actin data compared to the active actin-microtubule data shows that the microtubules are able to organize actomyosin activity and enable controlled contraction. Data shown are from six different replicates.
