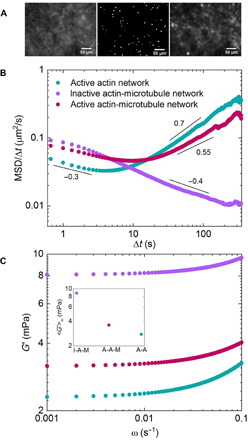
Fig. 5. Particles in active actin-microtubule networks exhibit subdiffusive behavior at short lag times, while near-ballistic motor-driven behavior dominates their long-time dynamics.

(A) Sample image from one of the movies (movie S9) used for particle-tracking analysis of active actin-microtubule networks (center). Images of microtubules in the network before (left) and after (right) experiments. Scale bars, 50 μm. (B) Mean squared displacements (MSDs) of microspheres embedded in cytoskeleton networks, determined via particle-tracking algorithms, divided by the corresponding lag time (Δt) as a function of Δt. MSD/Δt curves for active actin-microtubule (magenta), active actin (teal), and inactive actin-microtubule (purple) networks are shown. Scaling bars and corresponding numbers show approximate power-law scaling of MSD/Δt curves. Particles in inactive actin-microtubule networks exhibit subdiffusive behavior over the entire experimental window, while in active actin networks, they exhibit near-ballistic dynamics over the majority of the experimental lag times. In active actin-microtubule networks, on the other hand, particles exhibit subdiffusion similar to inactive networks for short lag times but transition to dynamics similar to active actin networks at large lag times. (C) Elastic moduli G′(ω) derived from the MSDs shown in (B). The frequency range shown corresponds to the time scales over which active dynamics (i.e., ballistic motion) are evident in (B). Inset shows <G′>, averaged over all frequencies shown, for each G′(ω) curve displayed. Color code is shown in (B).
