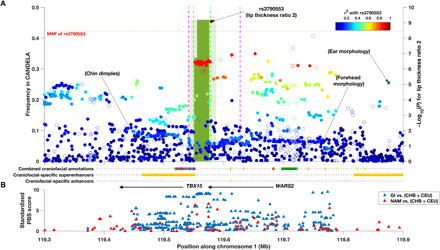
Fig. 3. Evidence of association, Denisovan introgression, and selection in the WARS2-TBX15 region.

(A) Association P values (right y-axis) with lip thickness ratio 2 and the location and frequency (left y-axis) of introgressed haplotypes inferred in the CANDELA data. Filled dots indicate the SNPs retained for introgression analysis. Dots are plotted accordingly to the significance of their association and have been colored to reflect r2 with the index SNP for association with that trait (rs3790553). The location of the index SNPs associated previously with ear morphology (15), chin dimples (7), and forehead shape (10) is indicated. SNPs associated with facial features in the European meta-analysis (18) are outside the region shown here. The green bins show the introgressed region, and their height displays the allelic frequency and their shade refers to the confidence level at which the tract was called (pale, 20%; dark, 90%). The dashed lines denote the bounds of the Denisovan introgression region previously estimated with the same approach used here (green) (31) or using a Conditional Random Field approach (purple) (32). (B) Standardized PBS scores obtained for genotyped SNPs when contrasting Native Americans (NAM) to CHB + CEU (red triangles) or Greenland Inuits (GI) to CHB + CEU (blue triangles). The location of the TBX15 and WARS2 genes is indicated by black arrows along with various annotations inferred from human embryonic tissue (27) (the color key for combined craniofacial annotations can be found in table S6).
