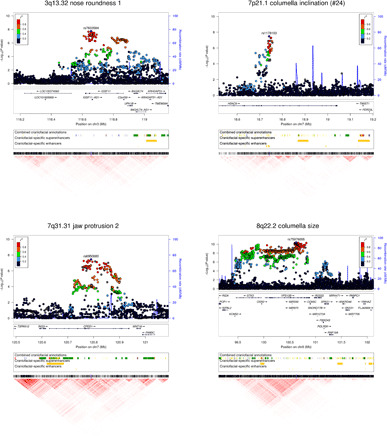
Fig. 4. Features of four genomic regions newly associated with face features in the CANDELA sample and replicating in Europeans.

Regional association P values (index SNP is labeled) are shown at the top. Regulatory annotations from human embryonic tissue (27) (combined chromatin states at various Carnegie stages and craniofacial-specific enhancers and superenhancers; the color key for combined craniofacial annotations is in table S6) are provided below each association plot. A heatmap of pairwise LD (r2) in the region is shown at the bottom of each panel. Similar plots for the other previously unidentified regions, detected in the CANDELA sample but not replicating in the European meta-analysis, are shown in Supplementary Notes.
