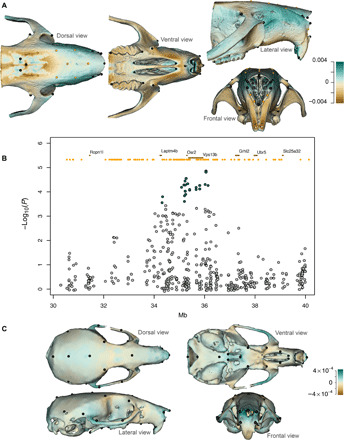
Fig. 5. Vps13b and mouse craniofacial shape.

(A) Shape changes in the Vps13b KO mutant male mice relative to WT. Effect is predicted according to the expected marginal means at the populational average centroid size. Darker colors represent strong positive (blue) or negative (brown) deviation from the WT, given in Procrustes distance. Positive distance represents expansion from the WT, whereas negative distance represents contraction from the WT. Mesh warping is amplified by a factor of 2 to facilitate the visualization (see also movie S1). (B) Regional association plot for the VPS13 homologous region in chromosome 15 among outbred mice. Significantly associated SNPs are shown as green dots (FDR < 5%). Ensembl annotations for genes (brown) and enhancers active in embryonic facial prominence (orange) are shown at the top. (C) Phenotypic effect associated with allele dosage at the Vps13b index SNP among outbred mice. Skull zones with an expansion/contraction relative to the mean shape are shown in brown/blue (see also movie S2). To facilitate visualization, shape variation has been magnified by ×20.
