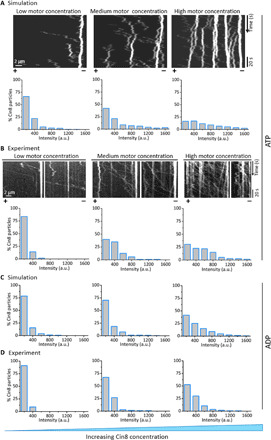
Fig. 6. Dependence of motility and clustering on concentration of Cin8.

(A) Concentration-dependent clustering in simulations, in the presence of ATP. Top: Kymographs for different concentrations of Cin8, generated by simulations of the theoretical model. Bottom: Corresponding model-generated histograms of intensities of Cin8 motors bound to MTs at increasing concentrations of Cin8. (B) Experimental data for concentration-dependent clustering of Cin8 on single MTs. Top: Representative kymographs obtained from time-lapse measurements of Cin8 motility at different Cin8 concentrations (see Materials and Methods). Bottom: Corresponding histograms of intensities of Cin8 motors bound to MTs at increasing concentrations of Cin8. (C and D) Comparison of the distribution of cluster sizes determined in experiments in the presence of ADP with those obtained in simulations of the model without active motion at different concentrations of Cin8. The nucleotide condition is indicated on the right. In (A) and (C), the attachment rates were computed on the basis of the measured attachment rate at medium concentrations (1 to 2 pM): kon = {3.62 ∙ 10−5, 4.82 ∙ 10−5, 9.04 ∙ 10−5} s−1 from the left to the right. Lattice size in the simulations was L = 2000; other parameters were as in Fig. 5A. The percentage of the respective cluster size observed in the simulations was computed by relating the summed existence times of all single particles and clusters for each of the different size categories. Concentrations of Cin8 in simulations were c = {0.75 − 1.5,1 − 2, 1.875 − 3.75} pM from the left to the right.
