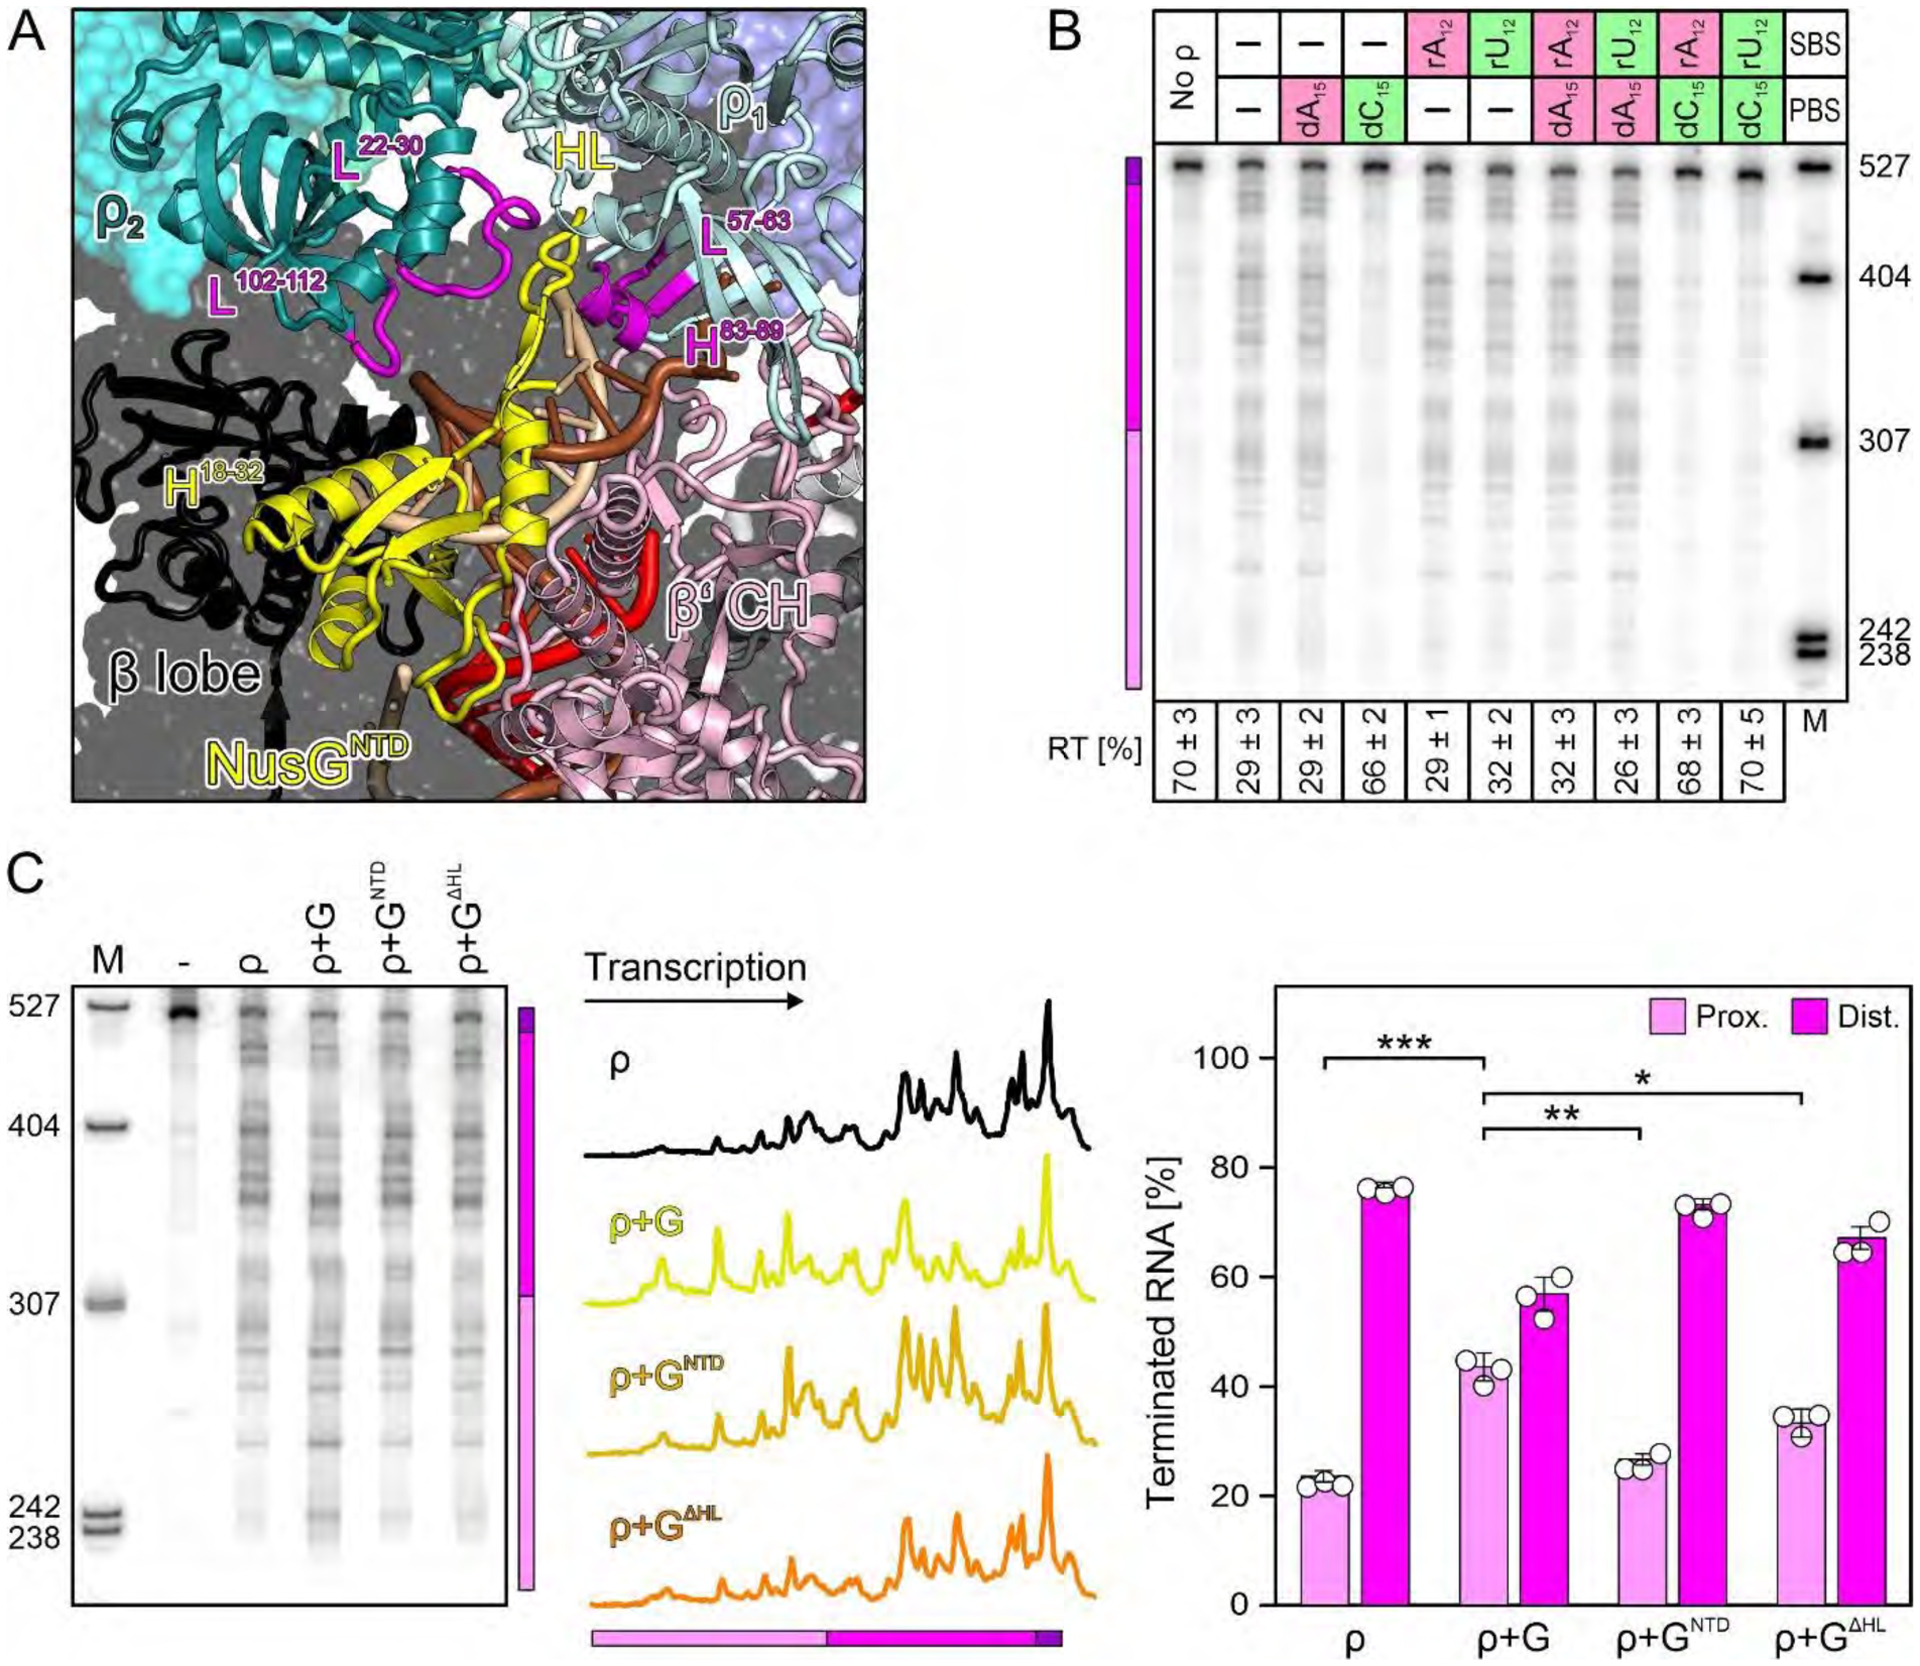
Fig. 2. Effects of ρ PBS/SBS ligands and NusGNTD.

(A) Effects of optimal (green) and poor (red) PBS/SBS ligands on ρ termination; here and in other figures, positions of proximal (pink) and distal (magenta) terminated RNAs and the read-through transcript (RT; purple) are indicated with a colored bar. PBS (dN15) ligands were present at 5 μM, SBS (rN12) ligands at 500 nM. A fraction of RT versus the sum of all RNA products is shown at the bottom. Values represent means ± SD of three independent experiments. (B) Close-up view on NusGNTD in the engagement complex. Elements discussed in the text, magenta. (C) Modulation of ρ effects by the indicated NusG (“G”) variants. The center panel shows lane profiles from the gel on the left; the Y-axis signals were normalized based on the total signal in that lane. The right panel shows a distribution of ρ-terminated RNAs between the proximal and distal regions. Values represent means ± SD of three independent experiments. * P<0.01; ** P<0.001; *** P<0.0001 [unpaired Student’s t-test].
