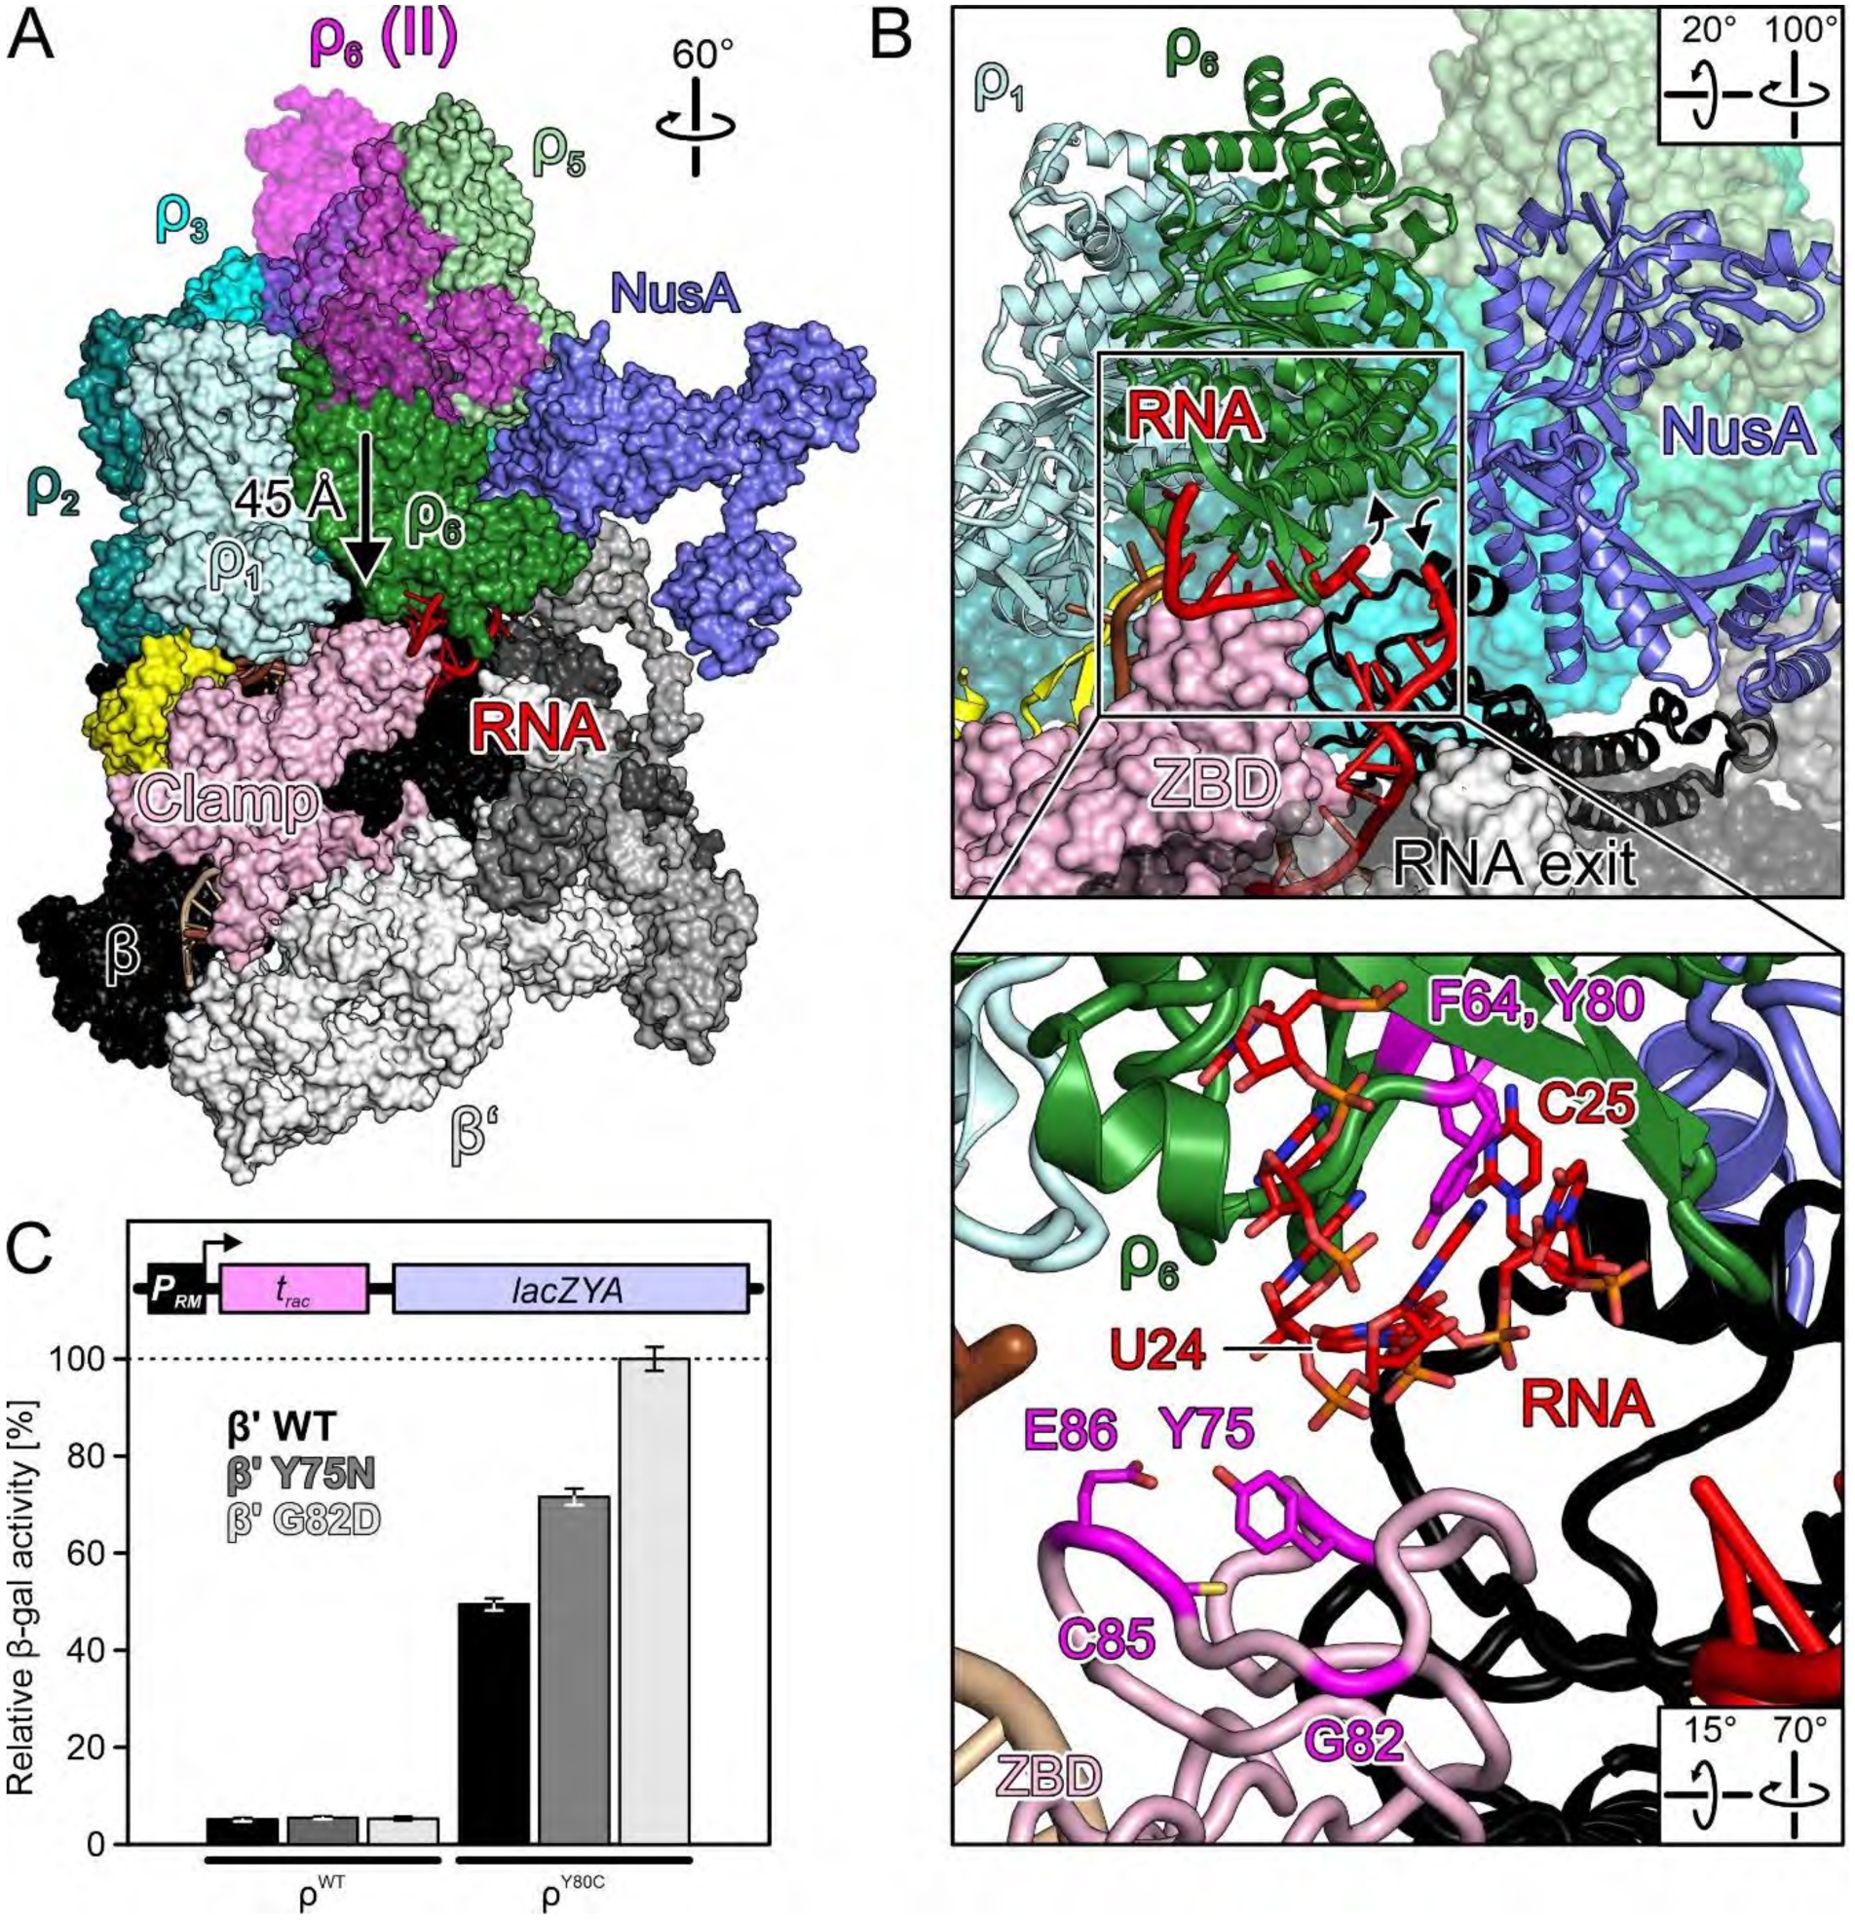
Fig. 5. RNA capture.

(A) Surface view of the RNA capture complex (nucleic acids as cartoon) with superimposed ρ6 from the primed complex. Arrow, movement of ρ6 during the transition from the primed to the RNA capture state. (B) Close-up views on ρ6PBS with bound RNA. Angled arrows, direction of intervening RNA region that might ascend 5’-to-3’ through the open ρ ring and return on the outside. Inset, details of RNA binding at ρ6PBS. 5’-portion of the RNA and selected ρ6PBS residues as sticks colored by atom type. In this and the following figures: Carbon RNA, red; carbon ρ residues, magenta; oxygen, light red, nitrogen blue; phosphorus, orange. (C) Quantification of β-gal activity derived from a reporter construct (scheme) in cells with ρWT or ρY80c, in the presence of the indicated plasmid-encoded β’ variants. Values represent means ± SEM of at least nine independent experiments.
