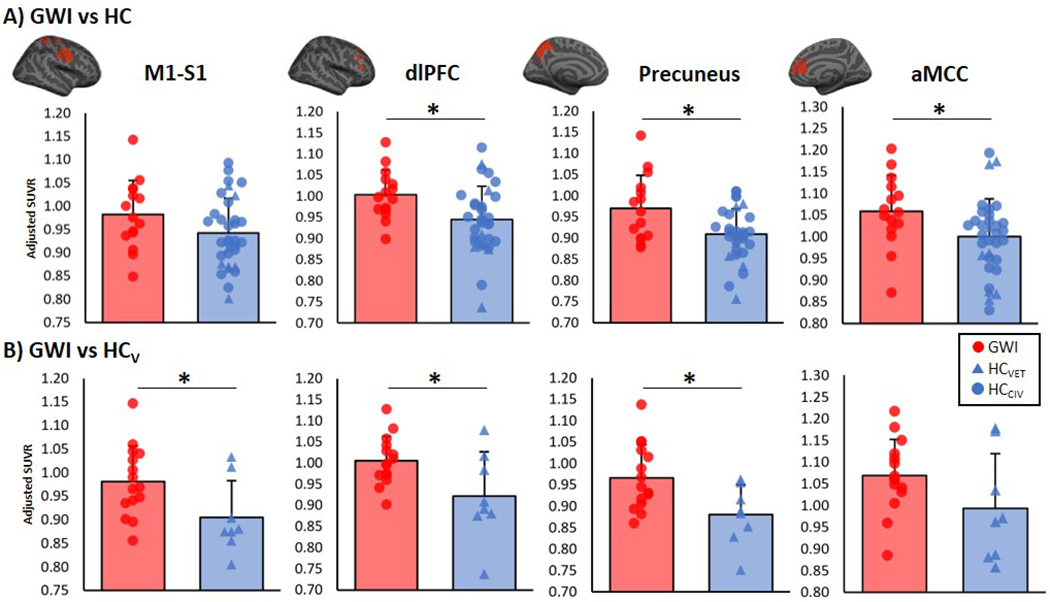
Figure 1: ROI analyses.

Group differences in [11C]PBR28 standardized volume uptake (SUVR) in a priori ROIs. These regions were selected as they demonstrated [11C]PBR28 PET signal elevations in fibromyalgia patients. Top panel: Average ± standard deviation SUVR extracted showing differences between GWI and HC (adjusted for genotype and sex). Bottom panel: Average ± standard deviation SUVR extracted showing differences between GWI and HCVET (adjusted for genotype). Surface projections of regions are displayed in red above the plots. * significant difference between groups (p < 0.05). M1 = primary motor cortex; S1 = primary somatosensory cortex; dlPFC = dorsolateral prefrontal cortex; aMCC = anterior mid cingulate cortex.
