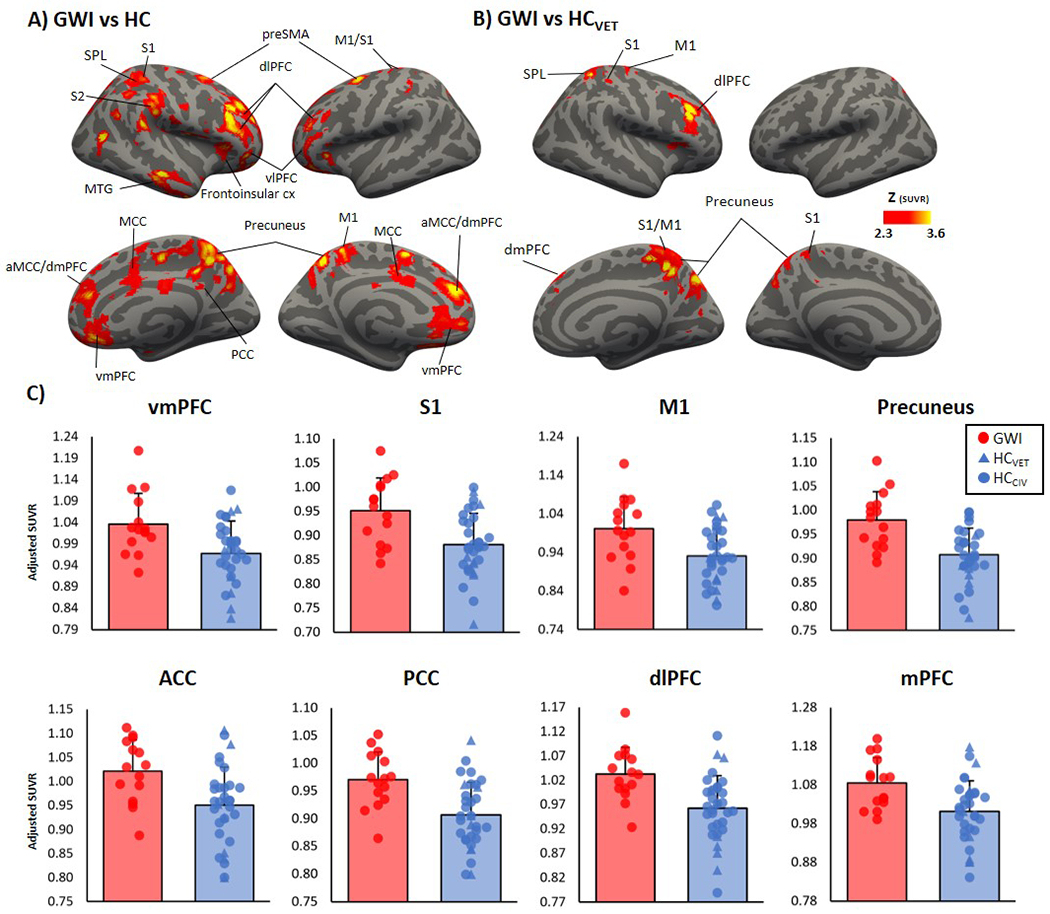
Figure 2:

Voxel-wise group difference in [11C]PBR28 standardized volume uptake (SUVR). A. Surface projection maps displaying areas with significantly elevated [11C]PBR28 SUVR in GWI (n=15) compared to HC (n=33), in voxel-wise analyses, data adjusted for sex and genotype. B. Surface projection maps displaying areas with significantly elevated [11C]PBR28 SUVR in GWI (n=15) compared to HCVET (n=8), in voxel-wise analyses, data adjusted for genotype. C. Average ± standard deviation SUVR extracted from several clusters identifies as statistically significant in the voxel-wise SUVR analysis from A. Data plots have been adjusted for sex and genotype. vmPFC = ventral medial prefrontal cortex; S1 = primary somatosensory cortex; M1 = primary motor cortex; ACC = anterior cingulate cortex; PCC = posterior cingulate cortex; dlPFC = dorsolateral prefrontal cortex; dmPFC = dorsomedial prefrontal cortex; mPFC = medial prefrontal cortex; aMCC = anterior mid cingulate cortex; SPL = superior parietal cortex; MCC = mid cingulate cortex; vlPFC = ventrolateral prefrontal cortex; S2 = secondary somatosensory cortex; cx = cortex.
